Figure 3
- ID
- ZDB-FIG-220131-191
- Publication
- Klaver et al., 2021 - Protease-dependent defects in N-cadherin processing drive PMM2-CDG pathogenesis
- Other Figures
- All Figure Page
- Back to All Figure Page
|
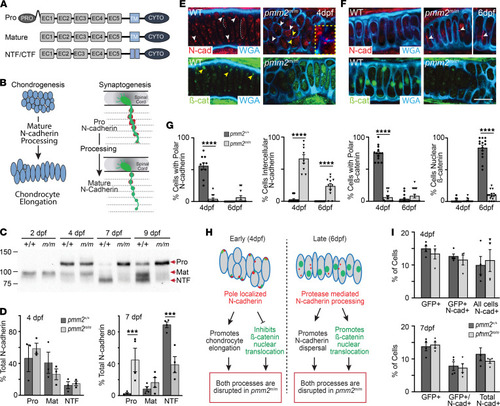
Defects in N-cadherin processing disrupt chondrogenesis in pmm2m/m embryos.
(A) Schematic representation of N-cadherin forms. N-cadherin contains a pro domain, 5 extracellular (EC1–EC5) domains, a transmembrane domain (62), and a cytosolic (CYTO) domain. Nonadhesive pro N-cadherin is proteolytically cleaved, creating mature N-cadherin (Mat). Additional processing generates signaling-competent N- and C- terminal fragments (NTF, CTF). (B) Schematic illustrates role of N-cadherin forms in chondrogenesis and synaptogenesis. Axons are shown in green and bungarotoxin-stained postsynaptic densities are red. (C) Representative N-cadherin Western blot reveals defects in processing in pmm2m/m embryos. n = 3 experiments with 15 embryos per sample per experiment. (D) Quantification of individual protein forms. Error bars show SEM, Student’s t test, ***P < 0.01. (E and F) Confocal images of chondrocytes stained immunohistochemically with N-cadherin (red) or β-catenin (green). Cell surface is stained with WGA (blue). White arrows highlight N-cadherin location. In +/+ it is primarily found at the cell poles, but in m/m N-cadherin interactions persist on opposing cell membranes. The yellow inset is a 2.5× magnification of the original panels of N-cadherin on opposing membranes. Yellow arrows highlight β-catenin location, and white dotted line highlights N-cadherin located laterally in elongated cells. Scale bars: 10 μm. (G) Graphs quantitating N-cadherin and β-catenin localization. Data presented as percentage cells within an individual cartilage. n = 10 embryos per genotype per age over 3 experiments. Error bars show SEM, Student’s t test, ****P < 0.0001. (H) Schematic illustrates model of N-cadherin localization and processing during normal and disrupted chondrogenesis. (I) The level of cell surface N-cadherin present in +/+ and m/m embryos. Shown is the percentage of total cells that are GFP+, GFP+ and N-cadherin+, or N-cadherin+. n = 3 experiments of 15, with cells isolated from pools of 15 embryos per sample. Error bars show SEM. |
| Antibodies: | |
|---|---|
| Fish: | |
| Anatomical Term: | |
| Stage Range: | Day 4 to Day 6 |
| Fish: | |
|---|---|
| Observed In: | |
| Stage Range: | Day 4 to Days 7-13 |

