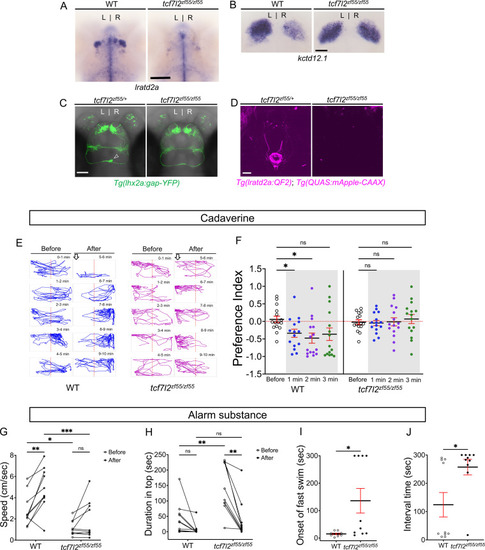
(A–B) (A) Absence of lratd2a-expressing right dHb neurons and (B) right-isomerized expression of kctd12.1 in tcf7l2 mutant larvae at five dpf. (C) Dorsal views of olfactory mitral neuronal projections of Tg(lhx2a:gap-YFP) larvae at 6 dpf. Open arrowhead indicates axon terminals of mitral cells in the WT right dHb that are absent in the mutant. (D) Dorsal views of dHb neuronal projections to the ventral IPN in Tg(lratd2a:QF2), Tg(QUAS:mApple-CAAX) larvae at 6 dpf. (E) Representative traces (1 min) for tcf7l2 mutant and WT sibling adults after application of cadaverine. (F) Preference index for mutants and WT siblings for an average of 2 min before (white) and for each of 3 min after (gray) the addition of cadaverine. Only WT fish showed a significant difference in their preferred location at 1 min (p = 0.0439) and at 2 min (p = 0.0184). For each group, n = 15 adults. Two-way ANOVA reveals a significant effect of time [F(3, 24) = 3.665, p = 0.046], group [F(1, 14) = 6.197, p = 0.026] and interaction [F(3, 30) = 7.953, p = 0.001]. Post-hoc analysis by Bonferroni’s multiple comparisons. Dashed red lines denote midpoint of test tank. (G) Swimming speed for 30 s before and after addition of alarm substance was1.13 ± 0.22 cm/s and 1.89 ± 0.56 cm/s for tcf7l2 homozygotes and 2.84 ± 0.48 cm/s and 4.88 ± 0.63 cm/s for their WT siblings, n = 10 fish for each group. Two-way ANOVA reveals significant effects of time [F(1, 9) = 19.31, p = 0.0021] and group [F(1, 9) = 13.91, p = 0.0047], but no effect of interaction [F(1, 9) = 3.933]. Post-hoc analysis by Bonferroni’s multiple comparisons. (H) Duration in the upper half of the test tank prior to and after addition of alarm substance for tcf7l2 adults was 143.58 ± 24.80 s and 38.77 ± 19.56 s and 43.68 ± 16.35 s and 8.19 ± 6.16 s for their WT siblings, n = 10 fish for each group. Two-way ANOVA reveals significant effects of time [F(1, 9) = 3755, p = 0.0002], group [F(1, 9) = 12.42, p = 0.0065] and interaction [F(1, 9) = 5.877, p = 0.0383]. Post-hoc analysis by Bonferroni’s multiple comparisons. (I) Onset of fast swimming after application of alarm substance occurred at 15 ± 2.65 s for WT and at 136 ± 44.86 s for tcf7l2 fish [p = 0.015, unpaired t-test]. (J) The time interval between increased swimming speed and freezing behavior was 124.2 ± 43.13 s for WT and 257.3 ± 27.43 s for tcf7l2 fish [p = 0.018, unpaired t-test]. For F-J, all numbers represent the mean ± SEM.