
Fig. 1
- ID
- ZDB-FIG-211216-1
- Publication
- Kim et al., 2021 - Maintenance of quiescent oocytes by noradrenergic signals
- Other Figures
- All Figure Page
- Back to All Figure Page
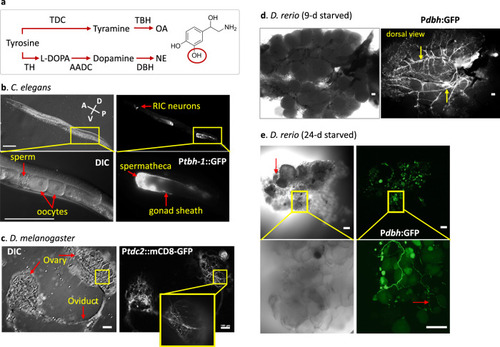
Noradrenergic innervation of ovaries in the three animals.
a The synthesis pathways of norepinephrine (NE) and octopamine (OA) and the enzymes for each step. TDC: Tyrosine decarboxylase, TBH: Tyramine β-hydroxylase, TH: Tyrosine hydroxylase, AADC: Aromatic L-amino acid decarboxylase, DBH: Dopamine β-hydroxylase, L-DOPA: L-Dihydroxyphenylalanine. NE is shown. The hydroxyl group (red circle) is absent in OA. b GFP driven by a tbh-1 promoter (Ptbh-1::GFP) is expressed in the gonadal sheath cells and the spermatheca in addition to RIC interneurons in the head of a 1-day old adult C. elegans. All 15 C. elegans examined showed similar expression pattern. The left panel shows developing oocytes surrounded by gonadal sheath (top) and the enlarged image of the inset in a DIC image (bottom). The right panel shows the GFP expression of tbh-1. The highest expression is observed in the spermatheca and the proximal three pairs of the gonadal sheath cells that surround diakinesis-staged oocytes. GFP is also expressed in a pair of RIC neurons in the head. c The expression of a tdc2-GAL4 reporter with a membrane targeting mCD8-GFP marks OA-expressing ovarian neurons originated from the abdominal nerves in a virgin female D. melanogaster. The neuronal branches cover the entire surface of the ovary. Similar tdc2-expression was observed from 18 flies. d EGFP driven by a dbh promoter is expressed in dbh-expressing neurons that surround the entire surface of the ovary in D. rerio. An image from a light microscopy shows many mature and growing oocytes in the ovary of 9-day starved zebrafish. The dbh-expressing nerves run along the main vasculatures on the dorsal side of the ovary (arrows). Similar dbh-expression was observed from 8 fish. e DIC and confocal images of the ovary of a 23-d-starved zebrafish. Degenerating oocytes are shown (red arrow). A higher magnification image (bottom) shows small-sized varicosities along the neurons (red arrow). Similar dbh-expression at lower magnification was observed from four fish. b–e Scale bar = 100 µm. |