
Figure 5
- ID
- ZDB-FIG-211129-90
- Publication
- Bhatia et al., 2021 - Quantitative spatial and temporal assessment of regulatory element activity in zebrafish
- Other Figures
- All Figure Page
- Back to All Figure Page
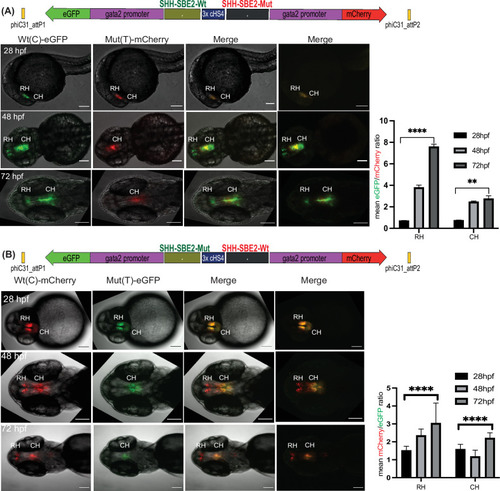
Dye swap experiment with SHH-SBE2 enhancer wild-type Wt(C) allele and Mut(T) allele bearing a holoprosencepaly- associated mutation (A: Wt(C)-eGFP/ Mut(T)-mCherry; B: Wt(C)-mcherry/ Mut(T)-eGFP).Top: Schematic representation of the test construct indicating the reporter genes driven by the two alleles. Bottom: confocal images and histogram of average of mean fluorescence intensities ratio (A:eGFP/mCherry; B:mcherry/eGFP) in the rostral (RH) and caudal (CH) hypothalamus for F1 embryos derived from founder lines bearing the test construct described (n≥5, error bars indicate standard deviation). At earlier stages of development (28-36 hpf, no significant difference in activity was observed between the two alleles). However at later stages of development (48 hpf and 72h pf) the mutant allele failed to drive reporter gene expression in the RH, and had significantly weaker activity in the CH at 72 hpf. Raw data used for plotting the graphs is provided in Figure 5—source data 1. ****p<0.0001, **p<0.01 (computed by two-tail student t-test). Scale bar = 100 μm.
|