
Fig 4
- ID
- ZDB-FIG-211121-9
- Publication
- Martínez-Morcillo et al., 2021 - NAMPT-derived NAD+ fuels PARP1 to promote skin inflammation through parthanatos cell death
- Other Figures
- All Figure Page
- Back to All Figure Page
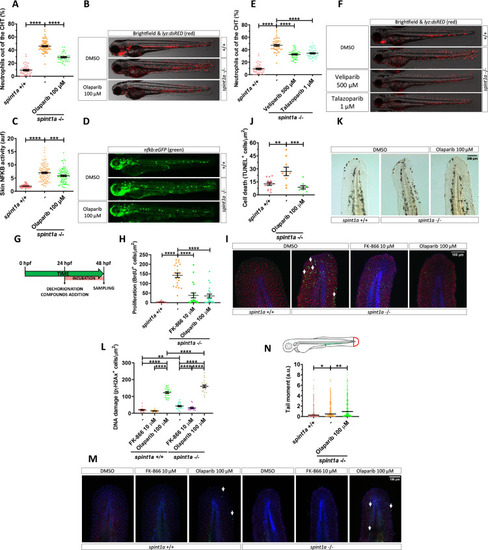
Pharmacological inhibition of Nampt and Parp1 alleviates skin oxidative stress and inflammation and keratinocyte cell death, hyperproliferation and DNA damage in Spint1a-deficient larvae.
Analysis of neutrophil distribution (A, E) and NFKB transcriptional activity in the skin (C) of wild-type and Spint1a-deficient larvae treated with olaparib (A, C), and veliparib or talazoparib (E). Representative images (brightfield and red channel in B, F; green channel in D) of lyz:dsRED and nfkb:eGFP zebrafish larvae of every group are shown. Determination of BrdU positive cells from 48 hpf wild-type and Spint1a-deficient zebrafish larvae treated for 24 hours with 10 μM FK-866 or 100 μM olaparib (G, H). Representative merge images maximum intensity projection of a confocal Z stack from zebrafish larvae of every group are shown (I). WIHC with anti-BrdU (green, arrows), anti-p63 (red, basal keratinocyte marker) were counterstained with DAPI (blue). Quantification of TUNEL positive cells from 48 hpf wild-type and Spint1a-deficient zebrafish larvae treated for 24 hours with 100 μM olaparib (J). Representative images of zebrafish larvae of every group are shown (K). Quantification of pγH2Ax positive cells from 48 hpf wild-type and Spint1a-deficient zebrafish larvae treated for 24 hours with 10 μM FK-866 or 100 μM olaparib (L). Similarly, around 60 zebrafish tail folds (red boxed area) were amputated and disaggregated into cells for comet assay analysis in alkaline conditions (N). Representative merge images of maximum intensity projection of an apotome Z stack from zebrafish larvae of every group are shown (M). WIHC with anti-pγH2Ax (green, arrows), anti-P63 (basal keratinocyte marker, red) were counterstained with DAPI (blue). Scale bars, 100 μm. Each dot represents one individual. The mean ± SEM (A-L) and median (N) for each group is shown. p-Values were calculated using 1-way ANOVA and Tukey multiple range test (A-L) and Kruskal–Wallis test and Dunn multiple comparisons test (N). *p ≤ 0.05, **p ≤ 0.01, ***p ≤ 0.001, ****p ≤ 0.0001. The data underlying this figure can be found in S1 Data. ANOVA, analysis of variance; Nampt, nicotinamide phosphoribosyltransferase; Parp1, Poly(ADP-Ribose) polymerase 1; TUNEL, terminal deoxynucleotidyl transferase dUTP nick end labeling. |
| Antibody: | |
|---|---|
| Fish: | |
| Conditions: | |
| Anatomical Term: | |
| Stage: | Protruding-mouth |
| Fish: | |
|---|---|
| Conditions: | |
| Observed In: | |
| Stage: | Protruding-mouth |