
Figure 3
- ID
- ZDB-FIG-211029-237
- Publication
- Perera et al., 2021 - Bucky Ball Is a Novel Zebrafish Vasa ATPase Activator
- Other Figures
- All Figure Page
- Back to All Figure Page
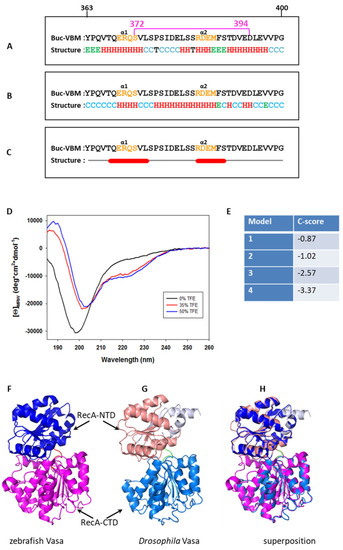
Buc-VBM adopts α-helices from its disordered nature in vitro. (A) In silico prediction of α-helices in Buc-VBM. In all three algorithms, the predicted α-helices are denoted as ‘H’ in red, β-sheets as ‘E’ in green, and turns as ‘T’ in black. The consensus secondary structure is shown at the bottom. Note that random coils in the consensus structure are denoted as ‘C’ in light blue. The first (363) and last (400) amino acids of Buc-VBM are displayed on top of the sequence (A–C). The highly conserved amino acids 372–394 are denoted by a pink, horizontal bar. (A) Secondary structure prediction using the CFSSP algorithm. The algorithm predicted two α-helices, α1 and α2. The α1-helix contains the amino acid sequence ERQS (orange), and α2 contains the amino acid RDEM (orange). CFSSP also predicted two β-sheets (green E), which contain the amino acids YPQ at the N-terminus and MFS at the C-terminus. (B) Secondary structure prediction using the PEP2D algorithm. The algorithm predicted two α-helices, α1 and α2, which share the same amino acids predicted by the CFSSP algorithm. (C) Secondary structure prediction using the Jnet algorithm. The algorithm predicted two α-helices, α1 and α2, which share the same amino acids predicted by the CFSSP algorithm and PEP2D algorithm. (D) Investigation of the secondary structure for Buc-VBM (amino acid 363–400) using CD spectroscopy. The Y-axis represents molar ellipticity ((θ)), which is corrected for the concentration. The X-axis represents the corresponding wavelengths. In the native aqueous conditions and neutral pH, the CD spectra calculated for Buc-VBM were typical for a disordered protein (very low CD spectra above 210 nm and negative spectra near 195 nm: black line). After the addition of different concentrations of the crowding agent TFE (35% red line and 50% blue line), Buc-VBM displays CD spectra characteristic for α-helices (negative CD spectra at 222 nm and 208 nm and positive spectra at 193 nm). (E) The C-score values predicted for the homology models of zfVasa by the I-Tasser program. (F) The model with the highest C-score (−0.87) was selected as the homology model for zfVasa. The RecA-NTD of zfVasa is colored in marine blue, while RecA-CTD is colored in salmon. (G) The structure solved for Drosophila Vasa (DmVasa). The structure is composed of the amino acids 200–623 (PDB ID 2DB3 [44]). RecA-NTD of DmVasa is colored in magenta, while RecA-CTD is colored in blue. (H) Superposition of the DmVasa and zfVasa structures using the PyMol tool shows that two structures have nearly identical secondary structures (root mean square deviation (RMSD) = 0.333). |