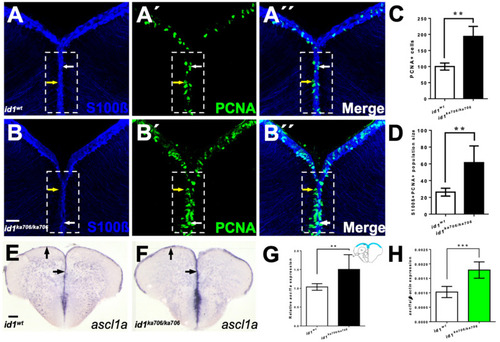
Loss of id1 function leads to an increased number of proliferating NSCs. (A–B’’) NSCs marked by immunohistochemistry with S100β (blue) and PCNA (green) antibodies on telencephalic cross-sections from adult id1ka706/ka706 and WT siblings. The number of PCNA+ cells per brain is increased in the mutant (B’, dashed white boxed area) compared to WT control brains (A’, dashed white boxed area). White arrows show PCNA+/S100β+ cells, yellow arrows show PCNA+ cells. White boxed area indicates area of quantification. (C) Relative population size of PCNA+ cells in WT and id1ka706/ka706 brains. (D) Quantification of the number of proliferating NSCs (type II cells, PCNA+/S100β+ cells) in id1ka706/ka706 and WT siblings. (E,F) Expression of achaete-scute-like1a (ascl1a) mRNA is increased in id1ka706/ka706 telencephala. Black arrows show the expression of ascl1a in the ventricular zone of id1ka706/ka706 mutants and WT siblings. (G) Quantification of ascl1a expression (scheme in the upper right-hand corner displays the quantified area in blue) in mutants and WT siblings. (H) RT-qPCR quantification confirms induction of ascl1a in id1ka706/ka706. Significance is indicated by asterisks: ** p < 0.01; *** p < 0.001. n = 3 brains (A–D), n = 15 sections (G), n = 5 telencephala (H). Scale bars: 20 μm (A–B’’) 100 μm (E,F).
|
