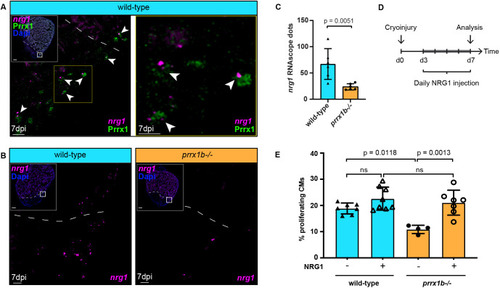
Prrx1b stimulates Nrg1 expression. (A) RNAscope in situ hybridization for nrg1 co-detected with Prrx1 antibody on 7 dpi wild-type hearts. Arrowheads indicate colocalization of nrg1 and Prrx1. Dashed line marks edge of the border zone. Insets show higher magnifications of the boxed areas. Scale bars: 100 μm (main panels); 10 μm (insets). Four hearts analysed. (B) RNAscope in situ hybridization for nrg1 on 7 dpi wild-type and prrx1b−/− hearts. Dashed line marks edge of the border zone. Insets show higher magnifications of the boxed areas. Scale bars: 100 μm (main panels); 10 μm (insets). (C) Quantification of nrg1 RNAscope dots in the BZ epicardium in 7 dpi wild-type (n=6) and prrx1b−/− (n=5) hearts. BZ epicardium is defined as a 100-μm-wide strip, 100 μm up and 100 μm down from where the edge of intact myocardium meets the epicardium (mean±s.d., P=0.0051, unpaired t-test). (D) Schematic of the workflow used for NRG1 injection experiments shown in E. (E) Quantification of the percentage of proliferating (PCNA+) BZ cardiomyocytes (mean±s.d., wild-type −NRG1 n=7; wild-type +NRG1 n=8; prrx1b−/− −NRG1 n=4; prrx1b−/− +NRG1 n=7; wild-type −NRG1 versus prrx1b−/−−NRG1 P=0.0118; prrx1b−/−−NRG1 versus prrx1b−/−+NRG1 P=0.0013; ns, not significant; one-way ANOVA followed by multiple comparisons analysis using Tukey's test).
|
