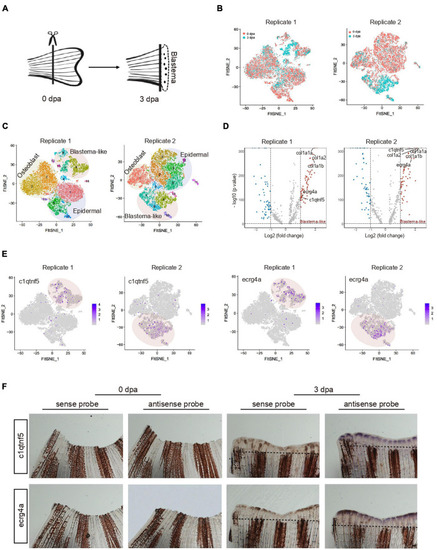
Characteristic of blastema cells during caudal fin regeneration. (A) A schematic of amputated primary caudal fin and blastema formed after 3 days. (B) t-SNE map of zebrafish caudal fin regeneration single-cell data from two independent biological replicates termed Replicate 1 (left) and Replicate 2 (right). Cells are colored by 0 and 3 dpa. (C) t-SNE map of zebrafish caudal fin regeneration single-cell data from Replicate 1 (left) and Replicate 2 (right). Cells are colored by cell-type cluster. (D) Volcano plot showing differentially expressed genes in blastema cells from Replicate 1 (left) and Replicate 2 (right). (E) Feature plot showing high expression of c1qtnf5 and ecrg4a in caudal fin regeneration single-cell dataset from Replicate 1 and Replicate 2. (F) Whole mount in situ hybridization against marker genes with sense and antisense probe in caudal fin at 0 and 3 dpa. Dashed lines indicate the amputation planes. n = 3 independent experiments. dpa, days post-amputation. scale bars, 200 μm.
|
