|
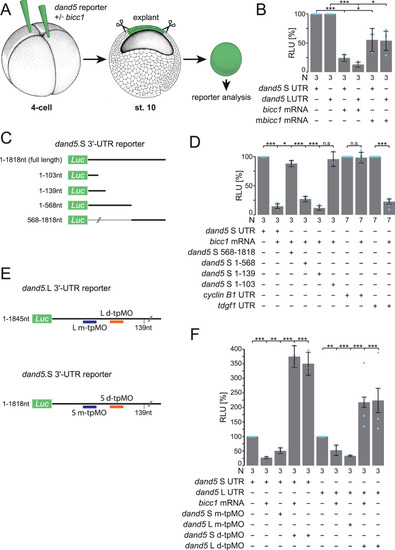
Bicc1 represses <italic>dand5</italic> mRNA translation via its proximal 3′-UTR.A Schematic depiction of dand5 reporter assay. dand5 3′-UTR sequences fused to luciferase coding were injected either with or without bicc1 mRNA into the animal region of four-cell embryos. At st. 10, the animal cap region was excised and assayed for luciferase activity. Adapted from refs. 65 and 66. B Animal cap reporter assay following injections of dand5 S- or L 3′-UTRs alone or together with Xenopus (bicc1) or mouse Bicc1 (mbicc1) effector mRNAs. Note that both alloalleles were equally repressed. Note also that mbicc1 was efficient as a repressor as well. C Luciferase reporter constructs harboring different regions of the dand5 (S-allele) 3′-UTR. D Repression of translation is mediated through a proximal 139 nucleotides (nt) sequence element in the dand5 3′-UTR. E Schematic depiction of medial and distal target protector MOs (m-tpMOs or d-tpMOs) binding to the minimal Bicc1 responsive element (Bicc1RE) in the dand5 3′-UTR (L or S). F m- and d-tpMOs (0.4 or 0.5 pmol/embryo, respectively) interact differently with the luciferase reporter expression. m-tpMO blocked and d-tpMO boosted luciferase activity. Co-injection of d-tpMOs prevented Bicc1-dependent repression of the full-length dand5 reporters (L and S) and further enhanced their expressivity. N in B, D, and F represents the number of independent experiments. A pool of 10 animal caps was analyzed per experiment and treatment. Results from reporter mRNAs alone served as reference and were set to 100% RLU. Relative values of single experiments are depicted as blue dots. Data of at least three experiments are presented as mean value (bar) ±standard deviation (error bar, SD). Statistical analyses were done with a one-sided Student’s t test for two independent means (Bonferroni corrected) using the values of at least three individual experiments. p values, values for individual experiments, the mean values, and standard deviations are found in the source data file. n.s. not significant p > 0.05; * significant, p < 0.05; ** highly significant p < 0.01; ***, very highly significant p < 0.001; RLU relative luciferase units; Lucluciferase.
|