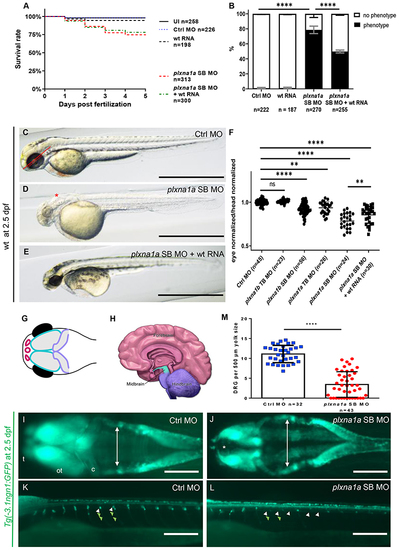
Fig. 4. Knockdown of plxna1a leads to cerebral anomalies and eye anomalies in zebrafish larvae. a Quantification of survival (N = 3), zfl injected with plxna1a splice blocking Morpholino (SB MO) show a slight but significant reduction (71% with a p value <0.0001, two-way analysis of variance [ANOVA]) of survival rate at 5 dpf compared to Ctrl MO (95%) and uninjected zfl (UI, 98%). Survival of plxna1a SB MO is not significantly rescued by co-injection of wt plxna1 RNA (p value <0.0001, Mantel–Cox test). b The graph shows 100% of surviving zfl at 2 dpf. 79% of plxna1a SB MO-injected zfl show a central nervous system (CNS) phenotype as hydrocephalus, smaller head and eye size (p value <0.0001, two-way ANOVA, N = 3) compared to 0% of UI and 1% of Ctrl MO-injected. The phenotype of plxna1a SB MO-injected zfl is significantly rescued by co-injection of wild-type (wt) PLXNA1 RNA (50% vs. 79%) (p value <0.0001, two-way ANOVA). Data are presented as means with standard error of the mean (SEM). c–e Brightfield images of zfl injected with Ctrl MO, plxna1a SB MO, or plxna1a SB MO + wt human RNA. Hydrocephalus (asterisk), hypopigmentation, smaller head and eye size are visible. The phenotype of plxna1a SB MO-injected zfl (d) is partially rescued by co-injection of wt PLXNA1 RNA (e). f Eye–head ratio of injected zebrafish larvae at 2 dpf. Measurement of the eye (dotted line) and head (distance between anterior tip up to the otic vesicle) (continuous line) was performed as visualized (c). Injection of plxna1b SB MO, plxna1a TB MO and plxna1a SB MO significantly reduced eye–head ratio (**p value 0.0024 or ****p value <0.0001; ordinary one-way ANOVA, N = 3), while wt RNA injection in plxna1a SB MO-injected zfl significantly rescues the phenotypic effect (p value 0.016). Data are presented as means with standard error of the mean (SEM). g Schematic of the CNS visible in dorsally mounted Tg(-3,1ngn1:GFP) zfl at 2 dpf. Pink: forebrain, turquoise: midbrain, purple: cerebellum (part of hindbrain), black: eyes. h Schematic of adult human brain (adapted from Midbrain. Blausen Medical. Retrieved on 29 February 2016. http://blausen.com/?Topic=9703). Pink: forebrain, turquoise: midbrain, purple: hindbrain. i, jTg(-3.1ngn1:GFP) zfl are mounted ventral and imaged from dorsal, the anterior to the left. The white arrows mark lateral borders of the hindbrain ventricle and asterisk mark dilatation of the forebrain ventricle (j). plxna1a SB MO-injected zfl show a dilatation of the ventricle at 2 dpf corresponding to the hydrocephalus seen in brightfield images. (j) Note the hypoplasia of telencephalon, mesencephalon, and cerebellum compared to the control (i). c cerebellum, ot optic tectum, t telencephalon. k, lTg(-3.1ngn1:GFP) zfl are mounted lateral, anterior to the left. plxna1a SB MO-injected zfl have a reduced number of dorsal root ganglions (DRG) (white arrowheads) and corresponding somites lack outgrowing axons (green arrowheads). m Quantification of DRG, normalized to yolk size (Figure S6). In plxna1a SB MO-injected zfl, the number of DRG is significantly reduced (mean of 3.44 ± 0.49 DRG/500 µm, Ctrl MO 11.1 ± 0.38 DRG/500 µm. P value <0.0001, unpaired t-test, N = 3). White scale bars in all figures: 200 µm. Black scale bars 1,000 µm. **p value <0.01 ****p value <0.0001.
|
