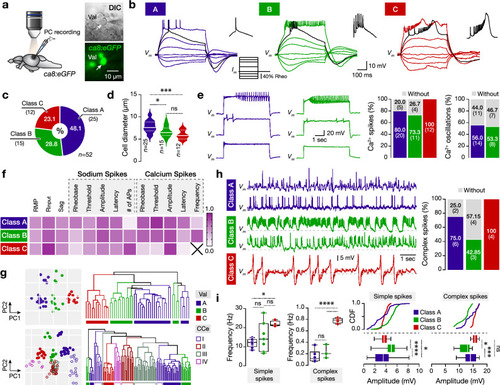
Variable firing, cellular, and spontaneous activity properties of the adult zebrafish valvular Purkinje cells. (a) Ex-vivo setup of an isolated intact brain from the Tg(Ca8:eGFP) line allows whole-cell patch-clamp recordings of valvular Purkinje cells. Arrow indicates a recorded cell. (b) The Purkinje cells show distinct firing patterns. Black trace shows the response at the rheobase. (c) Differential representation of the Purkinje cell firing classes in the adult zebrafish valvula cerebelli. (d) Valvula cerebelli Purkinje cells have different soma sizes. (e) Sample traces and quantification showing that part of firing class A and B Purkinje cells in valvula cerebelli fail to generate calcium-based spikes or repetitive calcium firing (oscillations). (f) Normalized mean values of the electrical properties detected for the valvular Purkinje cells are detailed in Supplementary Fig. S1. Normalizations were performed for each property to the highest obtained value. (g) PCA and hierarchical clustering plots depicting clusters of the valvular Purkinje cells (top) or valvular and corpus cerebelli Purkinje cells (bottom) based on physiological properties (as in (f)). Cells and data are colored by the assigned cell firing classification. (h,i) Sample traces showing the intense and variable spontaneous activity of the different Purkinje cell firing classes recorded in the adult zebrafish valvula cerebelli. Analysis of the presence, frequency and amplitude of simple and complex spikes between the Purkinje cells. CCe corpus cerebelli, CDF cumulative distribution frequencies, DIC differential interference contrast, Rheo rheobase, RMP resting membrane potential, Rinput input resistance, Val lateral part of valvular cerebelli. Data are presented as violin plots showing the median with quartiles and as box plots showing the median with 25/75 percentile (box and line) and minimum–maximum (whiskers). *P < 0.05; ***P < 0.001; ****P < 0.0001; ns not significant. For detailed statistics, see Supplementary Table S1.
|
