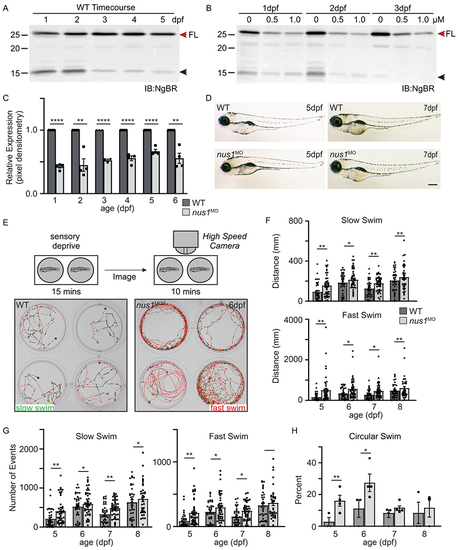
A) Western blots of 1-5dpf whole embryo lysates show NgBR is expressed during early development. Full length (FL) protein is indicated by a red arrowhead, as is a smaller processed piece. n=4 experimental replicates, 20 embryos per biological sample per experiment. B,C) Western blot show injection of 0.5 and 1.0 nM nus1 morpholino reduces NgBR abundance ~50% in embryos 1-6dpf. n=4 experimental replicates, 20 embryos per biological sample per experiment. D) Bright field images of WT and nus1 morphant (MO) embryos 5 and 7 dpf show no outward physical defects. n=100 embryos analyzed from 3 experiments. Scale bar=100μm. E) Schematic describes workflow for Zebrabox analyses of embryo motility. Image of 4 representative wells are shown from one plate containing WT and nus1 morphants. Traced swim patterns indicate the total path swam by the embryo, as well as swim speed. Red lines indicate a high velocity (fast) swim, while green lines indicate lower velocity (slow) swim. Images show nus1 morphants spend more time swimming at higher velocity than WT, often swimming in a circle around the well. F) Graphs summarizing the distance swam by an individual embryo (one dot) while at the fast or slow speed from 5-8 dpf. G) Graphs illustrate the number of new swim events initiated by an individual fish (one dot) while at the slow or fast swim speed from 5-8 dpf. H) Graphs illustrate the percent of total embryos in 4-5 experiments that exclusively swim in a circle at the edge of the well. n=50-100 embryos. For all quantitation: n= 50-75 embryos over 4-6 independent experiments. Error= S.E.M., significance calculated by the student’s t-test where *p<0.05, **p<0.01, ***p<0.001, ****p<0.0001.
|
