|
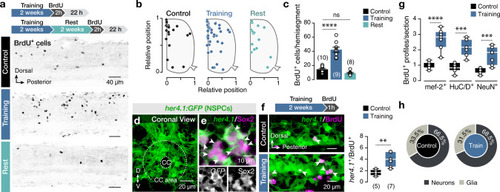
Exercise-induced transient activation of the NSPCs and neurogenesis in the adult spinal cord.a Inverted confocal images from whole-mount adult zebrafish spinal cord hemisegments showing cycling (BrdU+) cells in control animals (untrained), following 2 weeks of training and 2 weeks rest after training. b Similar distribution pattern of BrdU+ cells in the spinal cord comparing untrained, trained, and resting zebrafish. c Quantification of BrdU+ cells per hemisegment in different conditions show that the enhanced proliferation after training is reversible (P = 4.418E-10). d Expression pattern of her4.1:GFP (NSPCs; green) in close apposition of the adult zebrafish spinal cord’s central canal. e The vast majority (~97.5%) of the her4.1+ cells (green) express the stem cell marker Sox2 (magenta). Arrowheads indicate double-labeled cells. f Cycling her4.1+ radial glia cells (BrdU+, magenta; GFP, green). Training increased the number of BrdU+/her4.1+ cells per hemisegment. g Quantification of the average BrdU+ cells per spinal cord section co-expressing neuronal markers (mef-2, HuC/D, or NeuN) in untrained (control) and trained animals. h Proportions of BrdU+ cells expressing neuronal or glial markers are similar comparing untrained and trained animals. Quantification is based on the early neuronal marker mef-2. BrdU, 5-bromo-2ʹ-deoxyuridine; CC, central canal; GFP, green fluorescent protein; her4.1, hairy-related 4, tandem duplicate 1; HuC/D, elav3 + 4; mef-2, myocyte enhancer factor-2; NeuN, neuronal nuclei; NSPC, neural stem/progenitor cell; Sox2, sex-determining region Y-box 2. Data are presented as mean ± s.e.m. or as box plots showing the median with 25/75 percentile (box and line) and minimum–maximum (whiskers). **P < 0.01; ***P < 0.001; ****P < 0.0001; ns, not significant. For detailed statistics, see Supplementary Table 1.
|