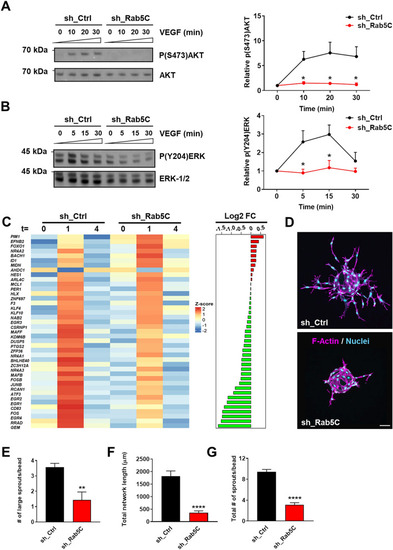
Rab5C regulates endosomal VEGF signaling, the immediate VEGF transcriptome, and sprouting angiogenesis. a Western blot analysis (left) and quantification (right) of phosphorylation of (S473)AKT and total AKT levels at 0, 10, 20, and 30 min of VEGF stimulation (50 ng/ml). b Western blot analysis (left) and quantification (right) of (Y204)ERK-1/2 phosphorylation and total ERK-1/2 levels at 0, 5, 15, and 30 min of VEGF stimulation (50 ng/ml). Representative blots are shown, α-tubulin served as a loading control. Quantifications are means + SEM from 3 independent experiments and expressed relative to t = 0. (c) HUVECs were starved overnight (t = 0), then stimulated with VEGF (50 ng/ml) for 1 h (t = 1) or 4 h (t = 4). VEGF-induced gene expression was then assessed by RNA-seq. Genes have been ordered based on the difference in mean log2 FC between sh_Ctrl and sh_Rab5C. Heatmap shows the corresponding centered and scaled mean expression values for VEGF-induced genes at the indicated time-points. Differences in mean log2 fold change (FC) between sh_Ctrl and sh_Rab5C after 1 h of VEGF stimulation are indicated on the right. Genes that have a higher mean expression in sh_Rab5C with respect to sh_Ctrl are indicated in red, those that have a lower mean expression in green. (d) Sprouting of sh_Ctrl (top) and sh_Rab5C (bottom) HUVECs from collagen-coated beads into fibrin gels. Cells were fixed at 48 h, stained for F-actin (magenta) and nuclei (cyan), and visualized by confocal microscopy. Representative images are shown (maximum projections from z-stacks). Scale bar, 75 μm. e Quantification of the average number of large sprouts/bead. Values represent the means + SEM of 3 independent experiments (20 beads per experiment). f Quantification of the total network length and g the total number of sprouts. A representative experiment is shown. Values represent the means + SEM of n = 16 beads per condition
|
