
FIGURE
Figure 1
- ID
- ZDB-FIG-210725-45
- Publication
- Andreana et al., 2021 - Toward Quantitative in vivo Label-Free Tracking of Lipid Distribution in a Zebrafish Cancer Model
- Other Figures
- All Figure Page
- Back to All Figure Page
Figure 1
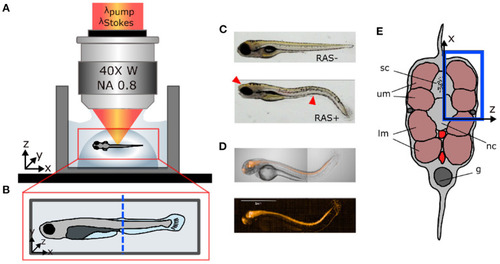
Sample preparation for |
Expression Data
| Gene: | |
|---|---|
| Fish: | |
| Stage: | Day 4 |
Expression Detail
Antibody Labeling
Phenotype Data
| Fish: | |
|---|---|
| Observed In: | |
| Stage: | Day 5 |
Phenotype Detail
Acknowledgments
This image is the copyrighted work of the attributed author or publisher, and
ZFIN has permission only to display this image to its users.
Additional permissions should be obtained from the applicable author or publisher of the image.
Full text @ Front Cell Dev Biol