
Fig. 3
- ID
- ZDB-FIG-210719-13
- Publication
- Poulsen et al., 2021 - Broad frequency sensitivity and complex neural coding in the larval zebrafish auditory system
- Other Figures
- All Figure Page
- Back to All Figure Page
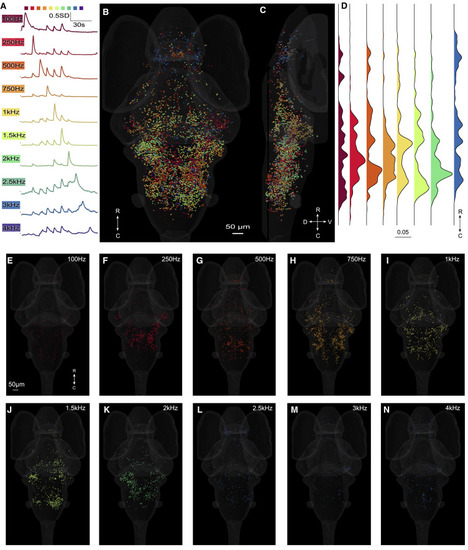
(A–C) The mean responses (A) of all ROIs selectively responding to each frequency in our stimulus train (top) and (B) their positions in the brain from a dorsal view and (C) a lateral view. Scale bar applies to both (B) and (C). (D) Using a one-dimensional kernel density estimation (KDE) computation, we looked at the density of frequency-selective ROIs at the whole-brain level, from rostral to caudal. Because of the overlapping responses and similar spatial distributions of ROIs responding to 2.5-kHz, 3-kHz, and 4-kHz tones, we combined these into a single category for (C) and (D). (E–N) Dorsal views showing ROIs of each frequency used in the stimulus train that passed the supervised analysis thresholding. The relevant frequency is indicated in each panel. Although the sound level to both ears is equal, there is asymmetry in the ROIs passing threshold due to the fish being illuminated from the front and one side. The right side, which receives a brighter and sharper SPIM plane, generally yields more ROIs that pass our inclusion criteria. |