
Figure 5
- ID
- ZDB-FIG-210712-48
- Publication
- Qu et al., 2021 - Loss of Wnt16 Leads to Skeletal Deformities and Downregulation of Bone Developmental Pathway in Zebrafish
- Other Figures
- All Figure Page
- Back to All Figure Page
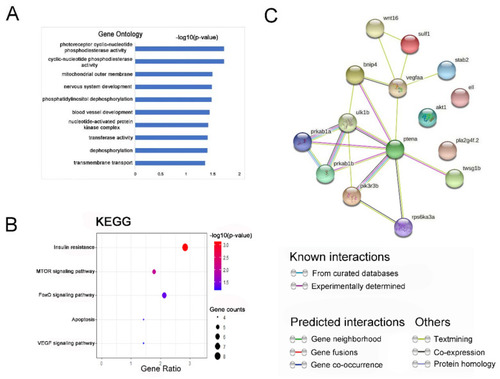
Gene ontology (GO) enrichment and Kyoto Encyclopedia of Genes and Genomes (KEGG) signaling pathway analysis of co-expression down-regulated DEGs. (A) GO analysis of co-expression down-regulated genes; bar plot shows the top ten enrichment score (−log10 (p-value)) of DEGs involving biological process, cellular component, and molecular function. (B) The significant changes in the KEGG pathway of co-expressed down-regulated genes. The bubble graph shows the enrichment score (−log10 (p-value)) of the significant pathway. The size of the circle represents the number of enriched DEGs. p-value was represented by a color scale, and the statistical significance increased from blue (relatively lower significance) to red (relatively higher significance). (C) Protein–protein interaction network of these fifteen DEGs and wnt16. Nodes represent genes, lines represent the interaction of proteins with genes, and the results within the nodes represent the structure of proteins. Line color represents evidence of the interaction between the proteins. |