FIGURE

Fig. 2

ID
ZDB-FIG-210712-33
Publication
Ding et al., 2021 - Metabolomic and transcriptomic profiling of adult mice and larval zebrafish leptin mutants reveal a common pattern of changes in metabolites and signaling pathways
Other Figures
All Figure Page
Back to All Figure Page
Fig. 2

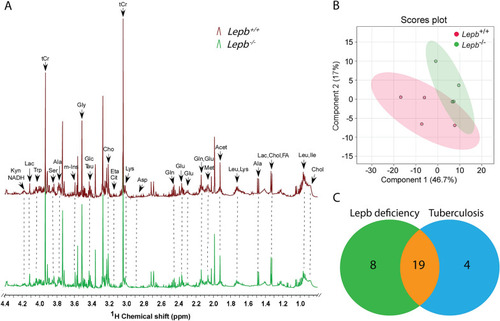
One-dimensional 1H NMR spectra and PLS-DA analysis of extracted lepb mutant zebrafish larvae. A The representative spectra of extracted larvae from wild type and lepb mutant groups measured by solution NMR spectrometry. Spectra from chemical shift 0.5–4.4 were assigned to specific metabolites. Acet acetate, Ala alanine, Arg arginine, Asp aspartate, Cho choline, Chol cholesterol, Cit citrulline, Eta ethanolamine, FA fatty acid, Glc glucose, Gln glutamine, Glu glutamate, Gly glycine, Ile isoleucine, Kyn kynurenine, Lac lactate, Leu leucine, Lys lysine, Met methionine, m-Ins myo-inositol, Ser serine, Tau taurine, tCr total creatine (creatine + phosphocreatine), Trp tryptophan, NMR nuclear magnetic resonance. B PLS-DA analysis of wild type and lepb mutant groups, n = 4, each replicate represents 105 pooled larvae. PLS-DA partial least square discriminant analysis. C A Venn diagram is shown of the common 19 metabolites that changed significantly towards lepb deficiency in extracted zebrafish larvae and tuberculosis caused by Mycobacterium marinum infection in extracted zebrafish larvae published by Ding et al. [26]

Expression Data

Expression Detail
Antibody Labeling
Phenotype Data

Phenotype Detail
Acknowledgments
This image is the copyrighted work of the attributed author or publisher, and ZFIN has permission only to display this image to its users. Additional permissions should be obtained from the applicable author or publisher of the image. Full text @ Cell Biosci.