FIGURE

Figure 3

ID
ZDB-FIG-210711-3
Publication
Serifi et al., 2021 - Targeting of SET/I2PP2A oncoprotein inhibits Gli1 transcription revealing a new modulator of Hedgehog signaling
Other Figures
All Figure Page
Back to All Figure Page
Figure 3

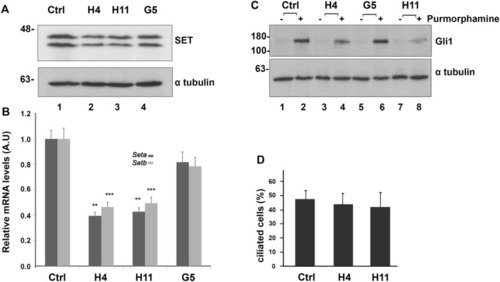
CRISPR/Cas9-mediated SETKD is linked with a decrease in Gli1 expression. (A) SET protein levels in NIH 3T3 control cells and SETKD clones. Western blot analysis of control NIH 3T3, H4, H11 and G5 cell extracts using the anti-I2PP2A and anti-α-tubulin antibodies (loading control). Original uncropped Western Blot images are shown in Supplementary Fig. 2S. (B) Comparison of the relative expression differences for Seta and Setb, the two splicing forms of mouse Set gene, in control NIH 3T3, H4, H11 and G5 cells. The fold changes in qPCR were normalized to Gapdh. Data are expressed as mean ± SEM (n = 3 ) **p < 0.01***p < 0.001. (C) Gli1 expression levels in control NIH 3T3 and SETKD cells. Western blot analysis of extracts obtained from control NIH 3T3 cells and H4, H11 and G5 cells after incubation at 0.5% serum with DMSO (lanes 1, 3, 5, 7) or 2 μM purmorphamine (lanes 2, 4, 6, 8) using the anti-Gli1 and anti-α-tubulin antibodies. Original uncropped Western Blot images are shown in Supplementary Fig. 2S. (D) Ciliation analysis of control NIH 3T3 cells and H4, H11 clones after 24 h of serum starvation. 100–150 cells were analyzed per experiment (n = 3).

Expression Data

Expression Detail
Antibody Labeling
Phenotype Data

Phenotype Detail
Acknowledgments
This image is the copyrighted work of the attributed author or publisher, and ZFIN has permission only to display this image to its users. Additional permissions should be obtained from the applicable author or publisher of the image. Full text @ Sci. Rep.