
Figure 6
- ID
- ZDB-FIG-210628-24
- Publication
- Issa et al., 2021 - Compromised N-Glycosylation Processing of Kv3.1b Correlates with Perturbed Motor Neuron Structure and Locomotor Activity
- Other Figures
- All Figure Page
- Back to All Figure Page
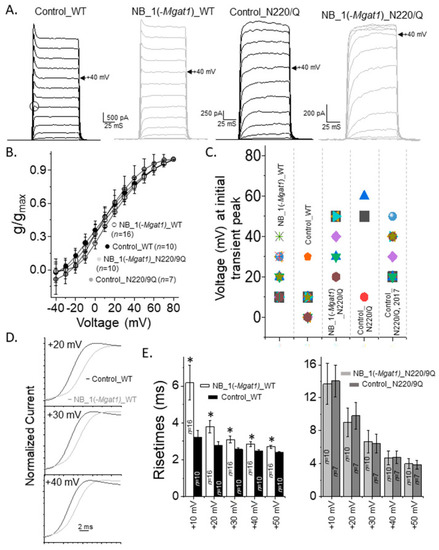
Opening rate of outward ionic current decreased as N-glycan branching is lessened. (A) Activation currents were elicited by holding cells at −50 mV and stepping from −40 mV to +80 mV in 10 mV increments for 100 ms. Whole cell currents were acquired for glycosylated Kv3.1b expressed in parental (Control_WT) and glycosylated mutant (NB_1(-Mgat1)_WT) cells and unglycosylated Kv3.1 in the mutant cell line (NB_1(-Mgat1)_N220/229Q). Open circle denotes transient peak at +10 mV. Control cell line is the parental cell lines, NB_1. Arrow points to current recorded at +40 mV. (B) Conductance-voltage (g/gmax) curves obtained from non-inactivating currents with and without transient peaks expressed by glycosylated (WT) and unglycosylated (N220/229Q) Kv3.1b in NB_1 and NB_1(-Mgat1). (C) Scatter plot illustrating voltage at which the initial transient peak was observed from non-inactivating current with transient peaks of the various cell lines and those from our past reports [16]. (D) Whole cell currents from activation voltage protocols in (A) were expanded for Control_WT and NB_1(-Mgat1)_WT cells lines. (E) Rise times of activation currents of the WT Kv3.1 (left panel) and N220/229Q (right panel) expressing cell lines. Data are presented as the mean ± SEM and were compared by Student’s t-test (* p < 0.05). |