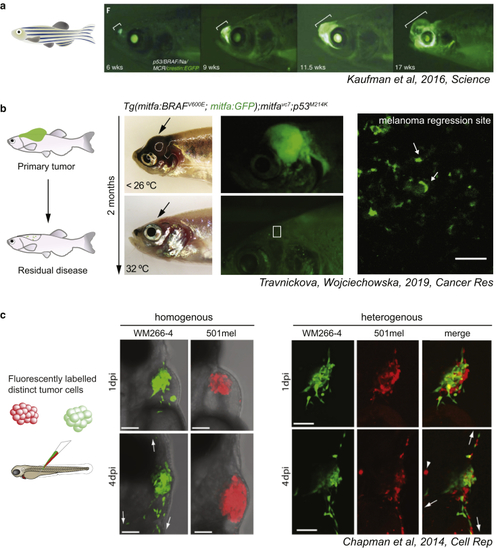
Selected examples of imaging melanoma cell states in zebrafish. (a) Capturing melanoma initiation in zebrafish. Melanoma-prone zebrafish expressing the neural crest transgene crestin:EGFP fish are tracked over time to follow melanoma initiation through tumor growth. Image was adapted from Kaufman et al. (2016). (b) Visualizing MRD. Brightfield and fluorescent images of zebrafish with primary melanoma and MRD. This model depends on a temperature-sensitive allele for MITF activity whereby Mitfa protein is depleted at the regression site while cells maintain GFP expression from the mitfa promoter. Turning MITF activity off by shifting the fish to the nonpermissive temperature leads to melanoma regression and evidence of MRD. Even in zebrafish with no overt evidence of disease, live GFP-positive persister cells are detected at the regression site (boxed region). Image was adapted from Travnickova et al. (2019).(c) Phenotypic cooperation between cell states. Homogenous xenografts of two fluorescent melanoma cell lines after transplantation into zebrafish embryos. Heterogeneous xenografts show cooperative migration. Images were adapted from Chapman et al. (2014) with permission from the American Association for the Advancement of Science (AAAS). MRD, minimal residual disease.
|
