FIGURE

Figure 2

ID
ZDB-FIG-210505-2
Publication
Crilly et al., 2021 - RNA-Seq Dataset From Isolated Leukocytes Following Spontaneous Intracerebral Hemorrhage in Zebrafish Larvae
Other Figures
All Figure Page
Back to All Figure Page
Figure 2

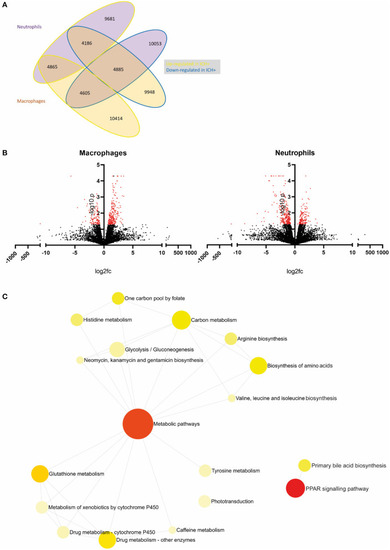
An example of primary analysis suggests metabolic pathways are dysregulated in leukocytes following ICH in zebrafish larvae. (A) Summary of gene expression across leukocyte samples in response to hemorrhage. Values outlined in yellow are upregulated and those outlined in blue are downregulated in hemorrhage. Values of genes expressed in neutrophils are in purple bubbles and those in macrophages are in orange bubbles. (B) Volcano plots showing the log2 fold change of gene expression in macrophages (left panel) and neutrophils (right panel) when compared to ICH– samples. Significant genes (p < 0.05, log10 > 1.3) are in red. (C) Network analysis reveals dysregulation in metabolic pathways in leukocytes following ICH. Metabolic pathways and PPAR signaling pathway pAdj = 0.004.

Expression Data

Expression Detail
Antibody Labeling
Phenotype Data

Phenotype Detail
Acknowledgments
This image is the copyrighted work of the attributed author or publisher, and ZFIN has permission only to display this image to its users. Additional permissions should be obtained from the applicable author or publisher of the image. Full text @ Front. Cell. Neurosci.