
Fig. 2
- ID
- ZDB-FIG-210429-2
- Publication
- Thouvenin et al., 2021 - Automated Analysis of Cerebrospinal Fluid Flow and Motile Cilia Properties in The Central Canal of Zebrafish Embryos
- Other Figures
- All Figure Page
- Back to All Figure Page
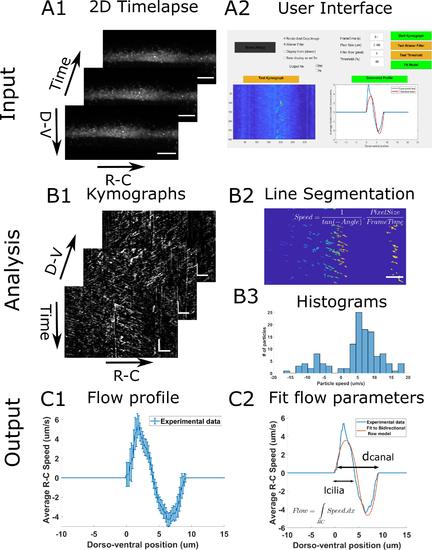
Principle of the CSF flow profile analysis workflow. The CSF flow profiles are calculated using 2D time lapses of fluorescent beads flowing in the central canal (A1), and our custom user interface software (A2). The Start Kymograph button starts the analysis by first calculating kymographs from 2D time lapses by swapping dimensions (B1). Each kymograph is filtered, and all lines, corresponding to one particle trajectory, are segmented (B2). The angle of each line is then transformed to a particle velocity value, and aggregated into a speed histogram for each D-V position (B3). The flow profile is then calculated by extracting the mean and standard error of each histogram (C1). The flow profile can finally be fitted to our bidirectional flow model, to extract quantitative flow parameters (C2). Horizontal scale bars are 15 µm and vertical scale bar is 5 s. |