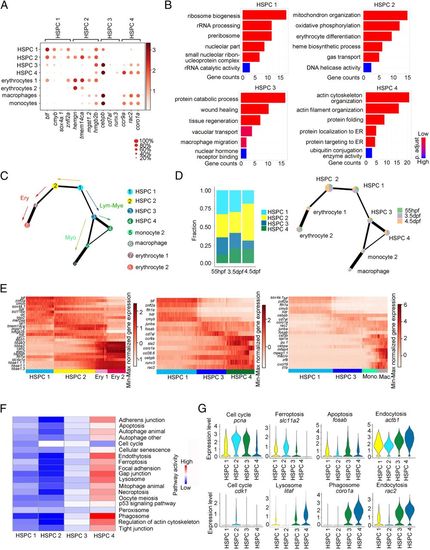
HSPC heterogeneity in lineage priming and metabolic gene signatures. (A) Dot plot of 14 selected DEGs for HSPC 1 through 4 and blood lineages (erythrocytes 1/2, macrophage, and monocyte 2). The size of the dot corresponds to the percentage of cells expressing the gene in each cluster. The color represents the average expression level. (B) The major GO terms enriched in HSPC 1 through 4. (C) PAGA visualization layout of HCs derived from HSPCs (15,084 cells). PAGA showing the putative developmental process from the root state (HSPC 1) to the branches (erythrocyte, myelocyte, and HSPC 4) passing through HSPC 2 and 3. (D) The fraction of four HSPCs at each development stage. (E) Heatmap showing the dynamic gene expressions based on PAGA-inferred trajectories from HSPC 1 to erythrocytes, HSPC 4, and macrophages, respectively. (F) The major metabolic pathway–activity score in HSPC 1 through 4. (G) Violin plots showing the expression of representative metabolic marker genes for cell cycle, ferroptosis, apoptosis, endocytosis, lysosome, and phagosome in HSPC 1, HSPC 2, HSPC 3, and HSPC 4.
|
