
FIGURE
Figure 3
- ID
- ZDB-FIG-210428-39
- Publication
- Suryanto et al., 2021 - Antidepressant Screening Demonstrated Non-Monotonic Responses to Amitriptyline, Amoxapine and Sertraline in Locomotor Activity Assay in Larval Zebrafish
- Other Figures
- All Figure Page
- Back to All Figure Page
Figure 3
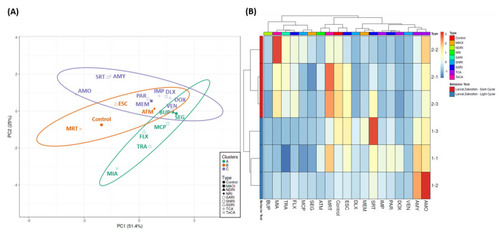
(A) Principal component analysis (PCA) and (B) hierarchical clustering analysis of locomotion behavior endpoints in zebrafish larvae after exposure to 1 mg/L of 18 different antidepressants. The untreated group is included as the control group. In (A), three major clusters from hierarchical clustering analysis results are marked with purple (1st cluster), orange (2nd cluster), and green (3rd cluster). |
Expression Data
Expression Detail
Antibody Labeling
Phenotype Data
Phenotype Detail
Acknowledgments
This image is the copyrighted work of the attributed author or publisher, and
ZFIN has permission only to display this image to its users.
Additional permissions should be obtained from the applicable author or publisher of the image.
Full text @ Cells