
Figure 3
- ID
- ZDB-FIG-210428-25
- Publication
- Gamble et al., 2021 - The Zebrafish Xenograft Models for Investigating Cancer and Cancer Therapeutics
- Other Figures
- All Figure Page
- Back to All Figure Page
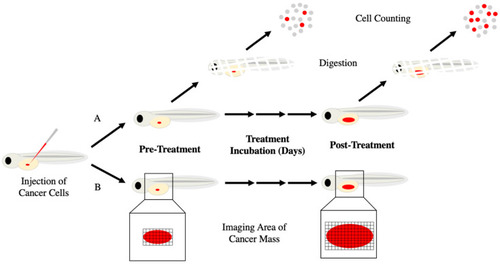
Methods of calculating cancer growth in zebrafish xenografts. Zebrafish embryos are engrafted with fluorescent cancer cells (red) by microinjection into the yolk sac and tumor progression is assessed in one of two ways. (A) Pre-treatment, a random subset of zebrafish is sacrificed, digested with collagenases, and fluorescent cells are counted. The remainder of the xenografts are exposed to treatment. After the treatment period, xenografts are digested, and cells are counted as before. Fold change in cell count reflects cancer growth/reduction. (B) Images are taken of the fluorescent cancer cells within the zebrafish at both pre- and post-treatment with fold change in area and fluorescent intensity indicating cancer growth/reduction. |