
FIGURE
Fig. 1
- ID
- ZDB-FIG-210426-1
- Publication
- Zhang et al., 2020 - Comparative sequence analysis and functional validation identified a retina-specific enhancer around zic5 and zic2a
- Other Figures
- All Figure Page
- Back to All Figure Page
Fig. 1
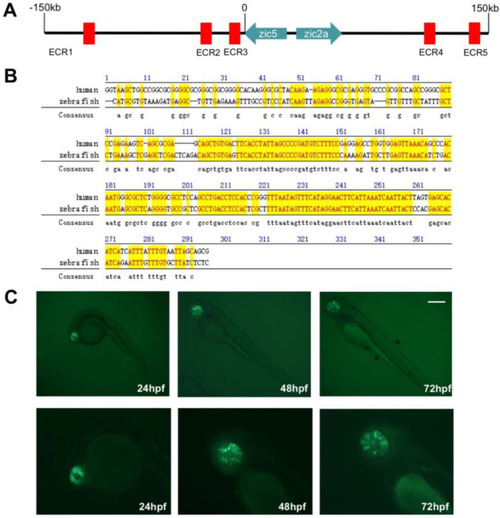
Identification of an eye-specific enhancer. (A) Sketch map of the position distribution of 5 ECR near zic5 and zic2a. Genes are shown as thick arrows, and their orientation indicates the translational direction of genes. ECRs are indicated by red rectangles. (B) ECR3 sequence alignment between human (hg19 assembly) and zebrafish (danRer7 assembly). (C) Lateral view of ECR3 driven GFP expression specifically in zebrafish eyes at 24hpf, 48hpf and 72hpf. Scale bar = 200 μm in all panels. |
Expression Data
Expression Detail
Antibody Labeling
Phenotype Data
Phenotype Detail
Acknowledgments
This image is the copyrighted work of the attributed author or publisher, and
ZFIN has permission only to display this image to its users.
Additional permissions should be obtained from the applicable author or publisher of the image.
Reprinted from Gene expression patterns : GEP, 39, Zhang, Q., Li, T., Zhang, Y., Lin, J., Chen, X., Gui, Y., Li, Q., Comparative sequence analysis and functional validation identified a retina-specific enhancer around zic5 and zic2a, 119162, Copyright (2020) with permission from Elsevier. Full text @ Gene Expr. Patterns