|
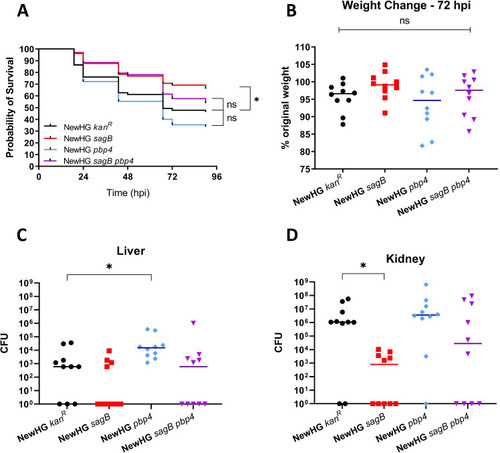
Analysis of growth and virulence of NewHG <italic>sagB pbp4</italic>.(A) Approximately 1500 CFU of bacteria (mutant or wildtype) was injected into the circulation valley of LWT zebrafish embryos around 30 hpf. A survival curve was produced comparing the virulence of parental NewHG (SJF 3663, black line) to: NewHG sagB::kan (SJF 4912, red line), NewHG pbp4::ery (SJF 5103, blue line) and NewHG sagB::kan pbp4::ery (SJF 5147, purple line). (3 repeats, n>20, * p = 0.0157). Mice (n = 10) were injected intravenously with approximately 1x10⁷ CFU S. aureus NewHG kanR (WT, SJF 3680), NewHG sagB::kan (SJF 4912), NewHG pbp4::ery (SJF 5103) or NewHG sagB::kan pbp4::ery (SJF 5147). (B) Weight loss 72 hpi and CFUs recovered from (C) livers (* p = 0.0119) and (D) kidneys (* p = 0.0055). Groups were compared using a Mann-Whitney U test (NewHG kanR–black circles, NewHG sagB::kan–red squares, NewHG pbp4::ery blue diamonds, NewHG sagB::kan pbp4::ery–purple triangles).
|