
Figure 3.
- ID
- ZDB-FIG-210414-55
- Publication
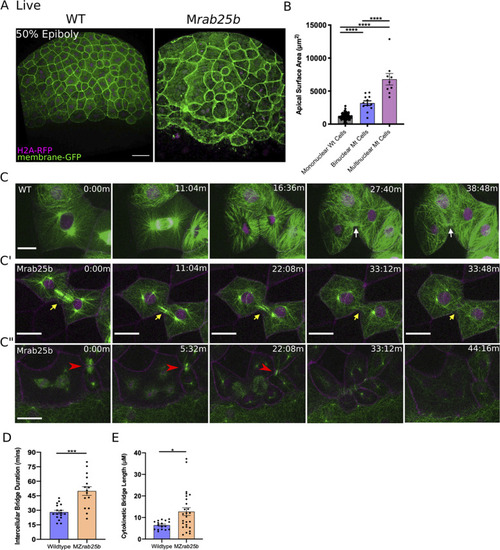
- Willoughby et al., 2021 - The recycling endosome protein Rab25 coordinates collective cell movements in the zebrafish surface epithelium
- Other Figures
-
- Figure 1
- Figure 1—figure supplement 1.
- Figure 2
- Figure 2—figure supplement 1.
- Figure 2—figure supplement 2.
- Figure 3.
- Figure 4
- Figure 4—figure supplement 1.
- Figure 5
- Figure 5—figure supplement 1.
- Figure 6
- Figure 6—figure supplement 1.
- Figure 7
- Figure 7—figure supplement 1.
- Figure 7—figure supplement 2.
- All Figure Page
- Back to All Figure Page
( |
| Fish: | |
|---|---|
| Observed In: | |
| Stage: | Dome |