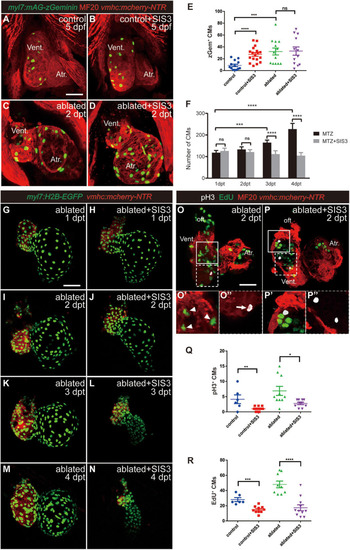
Smad3 inhibition affects CM proliferation during regeneration. (A–D) Representative fluorescence images of Tg(vmhc:mCherry-NTR; myl7:mAG-zGeminin) larvae with immunostaining of MF20 (anti-MHC) at 5 dpf/2 dpt showing zGeminin-positive CMs in the control or ablated hearts without or with SIS3 treatment. (E) Quantification of zGeminin-positive CM number in the control or ablated hearts without or with SIS3 treatment at 5 dpf/2 dpt. N = 13, 18, 13, and 12, respectively. Mean ± s.e.m., Student’s t-test, two-tailed; ns, non-significant; ***P < 0.001, ****P < 0.0001. (F) Quantification of CM nucleus number in the ablated hearts without or with SIS3 treatment at various time points. N = 8 for each group. Mean ± s.e.m., Student’s t-test, two-tailed; ns, non-significant; ***P < 0.001, ****P < 0.0001. (G–N) Representative fluorescence images of Tg(vmhc:mCherry-NTR; myl7:H2B-EGFP) ablated hearts without or with SIS3 treatment at various time points showing the change of CM nucleus number. (O–P″) Representative fluorescent images of Tg(vmhc:mCherry-NTR) hearts with immunostaining of phospho-histone H3 (white), MF20 (red), and EdU (green) in the ablated hearts without or with SIS3 treatment at 5 dpf/2 dpt. (O,P) Maximal projections of z-stack images, overlay of three channels. (O′,P′) Optical sections of enlargement of box area in panels (O,P), overlay of red and green channels. (O″,P″) Optical sections of enlargement of dashed box area in panels (O,P), overlay of red and white channels. Arrowheads point to EdU+ CMs; arrow points to pH3+ CMs. (Q) Quantification of pH3-positive CM number in the control or ablated hearts without or with SIS3 treatment at 5 dpf/2 dpt. N = 6, 11, 10, and 10, respectively. Mean ± s.e.m., Student’s t-test, two-tailed, *P < 0.05, **P < 0.01. (R) Quantification of EdU-positive CM number in the control or ablated hearts without or with SIS3 treatment at 5 dpf/2 dpt. N = 6, 10, 9, and 11, respectively. Mean ± s.e.m., Student’s t-test, two-tailed, ***P < 0.001, ****P < 0.0001. Scale bars, 50 μm. dpf, days post-fertilization, dpt, days post-treatment; atr., atrium; oft., out flow tract; vent., ventricle; CM, cardiomyocyte.
|
