
Figure 3
- ID
- ZDB-FIG-210409-230
- Publication
- Ren et al., 2021 - Characterization of Biological Pathways Regulating Acute Cold Resistance of Zebrafish
- Other Figures
- All Figure Page
- Back to All Figure Page
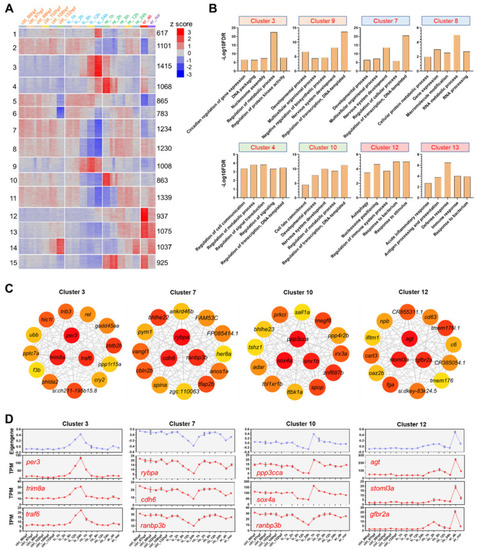
Clustering analysis, gene ontology (GO) enrichments and coexpression networks of the DEGs. (A) K-means clustering of the DEGs. Numbers of the clusters are displayed on the left. Numbers of genes in each cluster are shown on the right. The color scale indicates row z-score. (B) GO enrichments (biological process) for the representative clusters. (C) Hub genes of the indicated clusters. The gene coexpression network for each cluster was constructed by weighted gene coexpression network analysis (WGCNA) and the top 15 genes with the highest maximal clique centrality (MCC) were shown. The top 3 hubs were located in the middle of the circle. Color of node is proportional to the MCC. (D) Eigengene depicting overall gene expression of the representative clusters and expression of the top 3 hubs. |