|
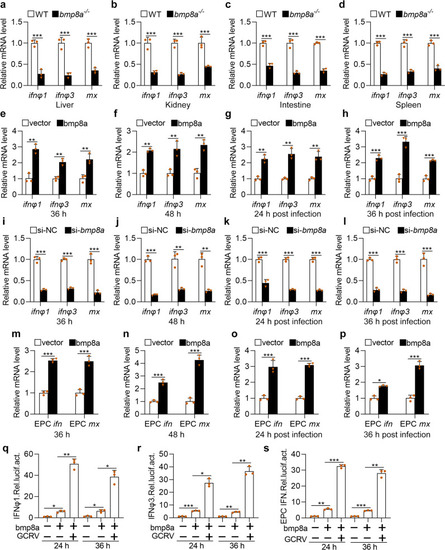
Bmp8a promotes antiviral innate immune responses.a–d Expression of ifnφ1, ifnφ3, and mx mRNA in the liver, kidney, intestine, and spleen from WT or bmp8a−/− zebrafish injected i.p. with 50 µl of GCRV (108TCID50 per ml) for 72 h. e, f Expression of ifnφ1, ifnφ3, and mx mRNA after transfected with bmp8a (2 μg) or empty vector (2 μg) in ZFL cells. The cells were collected at 36 h (e) or 48 h (f) post-transfection. g, h Expression of ifnφ1, ifnφ3, and mx mRNA after transfected with bmp8a (2 μg) or empty vector (2 μg) in ZFL cells for 24 h, followed by infection with GCRV for another 24 h (g) or 36 h (h). i, l Expression of ifnφ1, ifnφ3, and mx mRNA after bmp8a knockdown in ZFL cells. The cells were collected at 36 h (i) or 48 h (l) post knockdown. k, l Expression of ifnφ1, ifnφ3, and mx mRNA after knockdown bmp8a in ZFL cells for 24 h, followed by infection with GCRV for another 24 h (k) or 36 h (l). m, n Expression of EPC ifn and EPC mx mRNA after transfected with bmp8a (2 μg) or empty vector (2 μg) in EPC cells. The cells were collected at 36 h (m) or 48 h (n) post-transfection. o, p Expression of EPC ifn and EPC mx mRNA after transfected with bmp8a (2 μg) or empty vector (2 μg) in EPC cells for 24 h, followed by infection with GCRV for another 24 h (o) or 36 h (p). The expression of zebrafish actb1 or EPC actin was used as an internal control for the qRT-PCR. q–s EPC cells were transfected with IFNφ1pro-luc (200 ng, q), IFNφ3pro-luc (200 ng, r) or EPC IFN pro-luc (200 ng, s) respectively, with or without bmp8a (200 ng), followed by infection with GCRV. At the indicated time points, cells were collected for luciferase assays. Renilla luciferase was used as the internal control. Data were from three independent experiments and were analyzed by Student’s t-test (two-tailed) for comparison of two groups or one-way ANOVA followed by Games–Howell posthoc tests for comparison of multiple groups. All data were presented as mean ± SD (*p < 0.05, **p < 0.01, ***p < 0.001).
|