FIGURE

Figure 1

ID
ZDB-FIG-210327-61
Publication
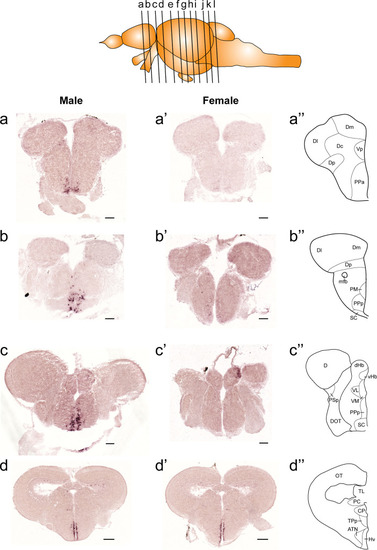
Ogawa et al., 2021 - Sexual Dimorphic Distribution of Hypothalamic Tachykinin1 Cells and Their Innervations to GnRH Neurons in the Zebrafish
Other Figures
All Figure Page
Back to All Figure Page
Figure 1

Comparison of expression patterns of tac1 mRNA in the forebrain regions of male (A−D) and female (A’−D’) zebrafish. In the top panel, a schematic drawing of an adult zebrafish brain (lateral view) showing levels of cross-sections presenting in Figures 1−3. Alphabets represent respective figure numbers (A−D: Figure 1, E−H: Figure 2, and I−L: Figure 3). In the most-right panels (A”−D”), a schematic drawing of half of the brain section (left side) processed for tac1 staining indicating major brain structures at this level. There was a sexually dimorphic expression of tac1 in the anterior part of the parvocellular preoptic nucleus (AA’), posterior part of the parvocellular preoptic nucleus (B, B’), and suprachiasmatic nucleus (C, C’). In contrast, no sexually dimorphic expression of tac1 was observed in the dorsal habenula (C, C’) and the ventral region of the periventricular hypothalamus (D, D’). Scale bars: (AC), (A’C’), 100 µm; (D, D’), 200 µm. See Glossary for abbreviation.

Expression Data
Gene:
Fish:
Anatomical Terms:
Stage: Adult

Expression Detail
Antibody Labeling
Phenotype Data

Phenotype Detail
Acknowledgments
This image is the copyrighted work of the attributed author or publisher, and ZFIN has permission only to display this image to its users. Additional permissions should be obtained from the applicable author or publisher of the image. Full text @ Front Endocrinol (Lausanne)