
FIGURE
Figure 7
- ID
- ZDB-FIG-210310-111
- Publication
- Zizioli et al., 2021 - Development of BCR-ABL1 Transgenic Zebrafish Model Reproducing Chronic Myeloid Leukemia (CML) Like-Disease and Providing a New Insight into CML Mechanisms
- Other Figures
- All Figure Page
- Back to All Figure Page
Figure 7
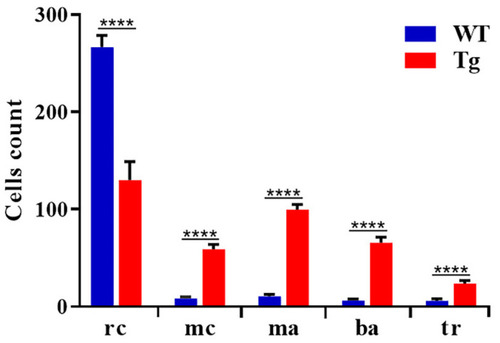
Quantification of different cell types in peripheral blood. Blood cells were counted manually based on their morphology and classified in different groups. We counted 500 cells per field for wild type (n = 15) and Tg BCR-ABL1 (n = 15). Statistical analysis was performed by unpaired, two-tailed T Test **** p< 0.0001. rc = red cells; mc = myeloid cells; ma = macrophages; ba = blast aggregates; tr = tromobocytes. |
Expression Data
Expression Detail
Antibody Labeling
Phenotype Data
| Fish: | |
|---|---|
| Condition: | |
| Observed In: | |
| Stage: | Adult |
Phenotype Detail
Acknowledgments
This image is the copyrighted work of the attributed author or publisher, and
ZFIN has permission only to display this image to its users.
Additional permissions should be obtained from the applicable author or publisher of the image.
Full text @ Cells