
Fig. 3
- ID
- ZDB-FIG-210303-77
- Publication
- Dapueto et al., 2020 - A novel nitroalkene vitamin E analogue inhibits the NLRP3 inflammasome and protects against inflammation and glucose intolerance triggered by obesity
- Other Figures
- All Figure Page
- Back to All Figure Page
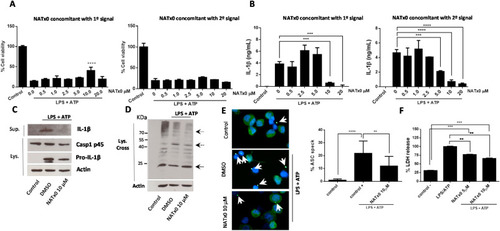
Fig. 3. NATx0 modulates NLRP3 inflammasome in differentiated THP-1 cells. A, % Cell viability calculated by MTT after NLRP3 activation, when NATx0 was applied in concomitant with LPS (“first signal protocol”) for 3 h and after with ATP for 45 min; or when NATx0 was applied together with ATP for 45 min (“second signal protocol”) after 3 h LPS stimulus. One-way ANOVA with Bonferroni's multiple comparison test: **** <0.0001. B, IL-1β formation is inhibited by NATx0 in a dose-dependent manner when it is applied together with first signal or second signal. One-way ANOVA with Bonferroni's multiple comparison test: *** = 0.001 0 vs. 10 μM NATx0; *** = 0.0002 0 vs. 20 μM NATx0 (left graph); *** = 0.0024; **** <0.0001 (right graph). C, Western blot analysis of proIL-1β, pro-caspase 1 (p45) and active IL-1β after inflammasome activation in the presence of 10 μM NATx0 or DMSO (vehicle) when applied in concomitant with “second signal”. D, Western blot analysis of ASC oligomers formation in crosslinked cells after inflammasome activation in the presence of 10 μM NATx0 or DMSO (vehicle) when applied in concomitant with “second signal”. ASC monomers were detected at 24 kDa, dimers at 48 kDa and oligomers over 65 kDa (dotted arrows). E, ASC “speck” detection by fluorescence microscopy after inflammasome activation in the presence of 10 μM NATx0 or DMSO when applied in concomitant with “second signal”. Cells were fixed, permeabilized and stained for ASC (green). Specks are denoted in white arrows. Percentage of ASC speck formation over ASC- positive cells is shown. One-way ANOVA with Bonferroni's multiple comparison test: **** <0.0001; ** = 0.0087. F, LDH (lactate dehydrogenase) release after inflammasome activation in the presence of 5 and 10 μM NATx0 or DMSO when applied in concomitant with “second signal”. One-way ANOVA with Bonferroni's multiple comparison test: *** = 0.0002; ** = 0.0098. Control in all cases refers to untreated cells. |