
Fig. 3
- ID
- ZDB-FIG-210217-51
- Publication
- Begeman et al., 2020 - Decoding an Organ Regeneration Switch by Dissecting Cardiac Regeneration Enhancers
- Other Figures
- All Figure Page
- Back to All Figure Page
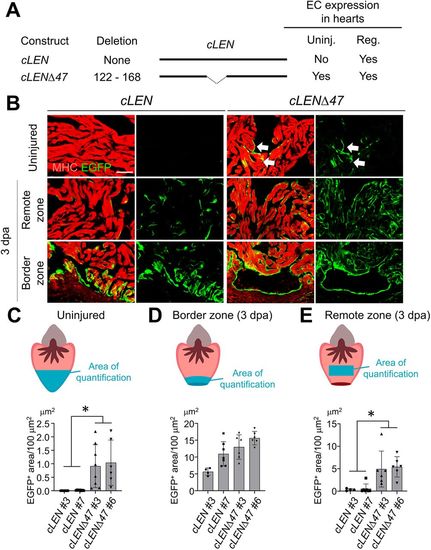
Active repression of cLEN establishes spatiotemporal gene expression in uninjured and regenerating hearts. (A) Transgene constructs examined for reporter gene expression. Endocardial expression results are summarized on the right. EC, endocardial cell. Uninj. and Reg. correspond to uninjured and 3 dpa regenerating hearts, respectively. (B) Images of sections of transgenic fish carrying cLEN and cLENΔ47. Top, uninjured hearts. Middle, remote zone of 3 dpa hearts. Bottom, border zone of 3 dpa hearts. The arrows indicate endocardial EGFP expression. (C-E) Top, schematic of uninjured and 3 dpa hearts. Area of quantification is marked in blue. Bottom, quantification of EGFP+ area per 100 µm2 cardiac tissue in uninjured hearts (C), border zone (D) and remote zone (E) of 3 dpa hearts. Data are presented as the mean±s.d. Numbers of animals are shown in Table S3. *P<0.05, one-way ANOVA with Tukey's post-hoc test. Scale bar: 100 µm in B. |