
Fig 5
- ID
- ZDB-FIG-210113-83
- Publication
- García-Jaramillo et al., 2020 - Nitrate and nitrite exposure leads to mild anxiogenic-like behavior and alters brain metabolomic profile in zebrafish
- Other Figures
- All Figure Page
- Back to All Figure Page
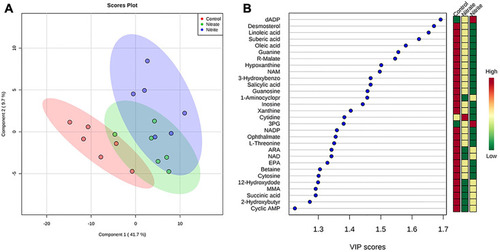
Adult zebrafish were treated with control water, sodium nitrate, or sodium nitrite for 31 days and brain metabolites were measured using untargeted LC-MS/MS. (A) Partial least squares discriminant analysis (PLS-DA) scored plot demonstrates spatial clustering and separation between treatment groups when considering all the annotated compounds. (B) PLS-DA variable importance in projection (VIP) graph of the most relevant 30 features (when considering the three treatments). Colored boxes at right indicate the mean relative concentrations of the corresponding metabolite in each treatment group under study. Red color indicates higher abundance, while green color indicates lower abundance. The PLS-DA model display 95% confidence region. Abbreviations: dADP (deoxyadenosine diphosphate), NAM (N-acetyl-L-methionine), 3-Hydroxybenzo (3-Hydroxybenzoic acid), 1-Aminocyclopr (1-Aminocyclopropane-1-carboxylate), 3PG (3-Phosphoglyceric acid), NADP (Nicotinamide adenine dinucleotide phosphate), ARA (Arachidonic acid), NAD (Nicotinamide adenine dinucleotide), EPA (Eicosapentanoic acid), 12-Hydroxydode (12-Hydroxydodecanoic acid), MMA (Methylmalonic acid), 2-Hydroxybutyrate (2-Hydroxybutyric acid). |