
Fig. 5
- ID
- ZDB-FIG-201228-2
- Publication
- Menon et al., 2020 - Dynamic optima in cell sizes during early development enable normal gastrulation in zebrafish embryos
- Other Figures
- All Figure Page
- Back to All Figure Page
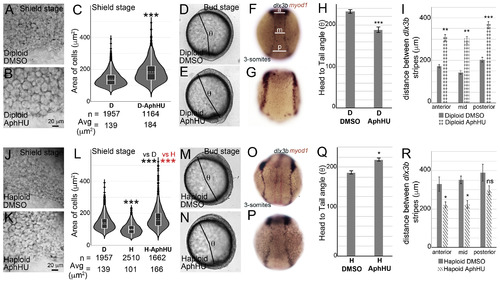
Gastrulation defects can be mimicked in diploids and rescued in haploids by increasing average cell areas.Diploids treated with DMSO (A, D, F) or AphHU (B, E, G). At shield stage, cell sizes in D-AphHU (B) are larger than in DMSO treated diploids (A). Cell area distributions, dotted horizontal line within box plots indicate mean value, n = number of correctly segmented cells that were used for area calculations from 3 embryos (C). D-AphHU embryos have a shorter body axis at bud stage, quantified as the head to tail angle (θ, D, E). Quantification of θ (H). RNA in situs for dlx3b (blue) and myod1 (red) at 3-somites for diploid DMSO (F, n = 29/29) and D-AphHU (G, n = 21/45). Quantification of the distance between dlx3b stripes along the AP axis at three sites anterior (a), mid (m) and posterior (p) as shown in F (I). Haploids treated with DMSO (J, M, O) or AphHU (K, N, P). At shield stages, cell sizes in H-AphHU (K) are larger than in DMSO treated haploids (J). Cell area distributions, dotted horizontal line within box plots indicate mean value, n = number of correctly segmented cells that were used for area calculations from 3 embryos (L). Body axis elongation quantified as θ, is rescued in H-AphHU (M, N, Q). RNA in situs for dlx3b (blue) and myod1 (red) at 3-somites for haploid DMSO (O, 16/26) and H-AphHU (P, n = 21/27). Quantification of the distance between dlx3b stripes along the AP axis at three sites anterior (a), mid (m) and posterior (p) as shown in F (R). Asterisks denote statistical significance based on Mann Whitney (C and L, P ≤ 0.001). Asterisks denote statistical significance based on unpaired t-test and One-way ANOVA (p ≤ 0.05), error bars represent Standard Error of Mean (SEM) for H, I, Q and R. |
Reprinted from Developmental Biology, 468(1-2), Menon, T., Borbora, A.S., Kumar, R., Nair, S., Dynamic optima in cell sizes during early development enable normal gastrulation in zebrafish embryos, 26-40, Copyright (2020) with permission from Elsevier. Full text @ Dev. Biol.