|
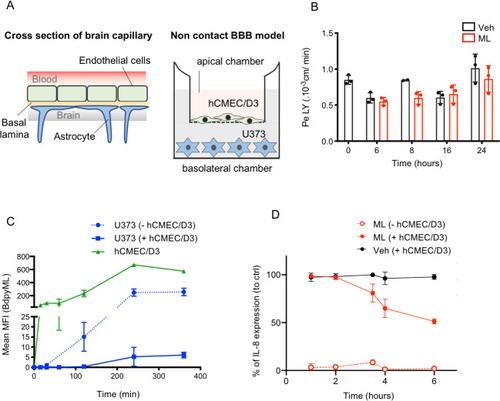
ML crosses an <italic>in cellulo</italic> model of human blood brain barrier.(A) left panel illustrates the basic structural organization of the BBB, right panel shows the in vitro transwell, non-contact BBB model used in this study. The human brain capillary endothelial hCMEC/D3 cells are seeded on the apical side of the insert and astrocytes U373 on the bottom of the baso-lateral compartment. Apical and basolateral compartment respectively mimic blood and brain compartments. (B) Permeability to LY as expressed in cm/min, after 6 to 24 h exposure to 1 μg of ML (red bars) or vehicle (DMSO, black bars). Data are means of 3 replicates +/- SD, and are representative of 3 independent experiments. Two-way Anova, no statistically significant difference between ML-treated and vehicle controls. (C) Incorporation of fluorescence across time (as detected by flow cytometry) in hCMEC/D3 (green line) and U373 cells (blue lines) following addition of 2.5 μg of Bdpy-ML on apical compartment in presence (plain line) or not (dotted line) of hCMEC. Data are mean MFI +/- SD of triplicates. (D) Production of IL-8 (expressed in percentage to control) by LPS-activated U373 cells after up to 6 hours of crossing of vehicle (Veh, black curve) and ML (red curves) on filter without hCMEC/D3 (dotted line) or with hCMEC/D3 (plain line). Data are mean percentages of 2 independent experiments in triplicates.
|