FIGURE

Fig. 4.

ID
ZDB-FIG-201202-17
Publication
Fornetto et al., 2020 - Colored visual stimuli evoke spectrally tuned neuronal responses across the central nervous system of zebrafish larvae
Other Figures
All Figure Page
Back to All Figure Page
Fig. 4.

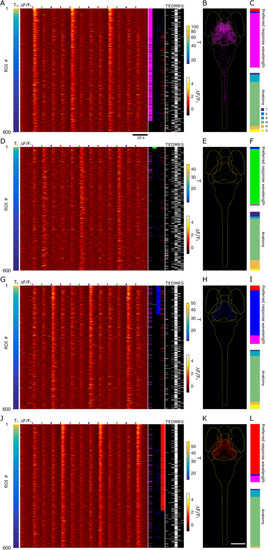
Spectrally tuned responses and anatomical distributions. ΔF/F0 heatmaps, spectral identity, and anatomical distributions of neurons selected for spectrally tuned responses above the threshold for UV (ac), violet (df), blue (gi), and red (jl) stimuli. See Fig. 3 for the general panel description. a, d, g, j Data from the same 5-dpf larva used for Fig. 3 but with neurons ranked based on L1, L2, L3, and L4 responses, respectively, as shown by the leftmost column. Data from all seven 5 dpf larvae, displaying neurons that passed selection criteria (threshold and peak analysis) for on L1 (b, c), L2 (e, f), L3 (h, i), and L4 (k, l) responses, respectively. Anatomical distributions of all responsive neurons (b, e, h, k), preferred response wavelength, and anatomy are shown (c, f, i, l). Scale bar, 190 μm

Expression Data

Expression Detail
Antibody Labeling
Phenotype Data

Phenotype Detail
Acknowledgments
This image is the copyrighted work of the attributed author or publisher, and ZFIN has permission only to display this image to its users. Additional permissions should be obtained from the applicable author or publisher of the image. Full text @ BMC Biol.