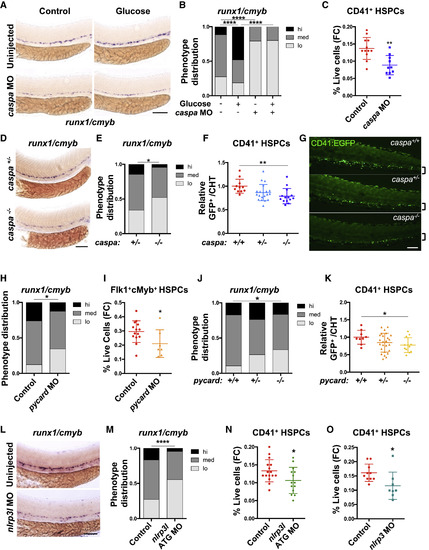
Inflammasome Action Regulates HSPC Formation (A) Expression of runx1/cmyb in embryos with or without morpholino (MO)-mediated caspa knockdown or 1% glucose treatment (12–36 hpf) assessed by WISH. (B) Phenotypic distribution plot of runx1/cmyb expression scored in embryos from (A) (n ≥ 50 /condition). (C) caspa knockdown reduces the frequency of CD41:EGFP+ HSPCs by flow cytometry (FC) at 48 hpf. (D) runx1/cmyb WISH in caspa+/− and caspa−/− embryos at 36 hpf. (E) Phenotypic distribution plot of runx1/cmyb expression scored in embryos from (D) (n ≥ 46 /condition). (F) CD41:EGFP+ HSPCs in the CHT of embryos from caspa+/− incrosses at 48 hpf. Counts normalized relative to caspa+/+ embryos for each clutch. Significance determined by Tukey’s multiple comparison test. (G) Representative in vivo images of CD41+ HSPCs in the CHT region (brackets) in embryos from (F). (H) pycard knockdown reduces runx1/cmyb expression by WISH (36 hpf; n ≥ 32 / condition). (I) pycard knockdown decreases the frequency of HSPCs in Tg(flk1:dsRed;cmyb:egfp) embryos by flow cytometry (48 hpf). (J) runx1/cmyb WISH in pycard−/− embryos compared with stage-matched pycard+/+ and pycard+/− embryos (n ≥ 29/condition). (K) CD41+ HSPCs in the CHT of embryos from pycard+/− incrosses. Counts were normalized relative to pycard+/+ embryos for each clutch. Significance was determined by Fisher’s LSD test. (L) runx1/cmyb expression in the aorta with or without nlrp3l knockdown. (M) Phenotypic distribution plot of embryo cohorts from (L) (n ≥ 85/condition). (N) nlrp3l knockdown decreases the frequency of HSPCs assayed by flow cytometry at 48 hpf. (O) nlrp3 knockdown reduces the frequency of CD41+ HSPCs at 48 hpf. ∗p < 0.05, ∗∗p < 0.01, ∗∗∗p < 0.001, ∗∗∗∗p < 0.0001. Scale bars, 100 μm. Error bars indicate SD. See also Figure S2.
|
