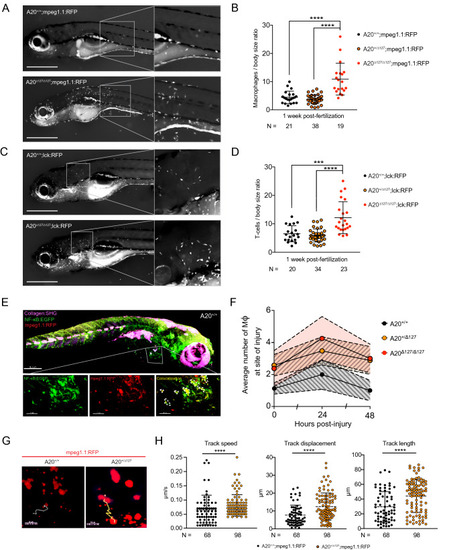
Impact of A20 deletion on macrophage activity in zebrafish. (A) Representative fluorescent image of A20+/+;mpeg1.1:RFP (top) and A20∆127/∆127;mpeg1.1:RFP (bottom) zebrafish at 1 wpf. (B) Number of macrophages counted from images of zebrafish by A20 genotype as in (A). Data represented as mean ± SD, P-values were determined using Whelch’s t-test. ****P < 0.0001. (C) Representative fluorescent image of A20+/+;lck:RFP (top) and A20∆127/∆127;lck:RFP (bottom) zebrafish at 1 wpf. (D) Number of dermal T lymphocytes counted from images of zebrafish by A20 genotype as in (C). Data represented as mean ± SD, P-values were determined using Whelch’s t-test. ***P < 0.001, ****P < 0.0001. (E) 3-D rendering of a Two-Photon microscope tilemap of a double-reporter (NF-κB:EGFP;mpeg1.1:RFP) A20+/+ zebrafish. The image shows three channels: Collagen (in magenta) generated through Second Harmonic, NF-κB (in green) generated though EGFP fluorescence and mpeg1.1 (in red) generated through RFP fluorescence. The accompanying video (Supplementary Video S3) navigates through the 3D rendering. IMARIS Image Analysis Software v8 (BITPLANE, Switzerland) (https://imaris.oxinst.com/). (F) Average number of macrophages at the site of injury measured at 24 and 48 h post-injury. Error bands are SEM. Area under the curve at 24 hpi was significant for A20+/+ x A20+/∆127 (*p < 0.05) and A20+/+ x A20∆127/∆127 (*p < 0.05). (G) Screenshots of a Two-Photon z-stack 15 min time-lapse track path of an A20+/+;mpeg1.1:RFP and A20∆127/∆127;mpeg1.1:RFP zebrafish in the resting state. The tracks show the path taken by a representative macrophage expressing RFP. The chosen macrophages are the closest to the average tracking data. (H) Macrophages from mpeg1.1:RFP positive zebrafish were imaged using in vivo two-photon microscopy and their track speed, track displacement and track length were quantified and used to determine a ‘meandering index’. Data collected from 4 A20+/+ and 3 A20+/∆127 comprising of 68 and 98 macrophages tracks respectively. Data represented as mean ± SD, P-values were determined using Mann–Whitney t-test. ****P < 0.0001. Software used for this Figure: GraphPad Prism v7.0 (https://www.graphpad.com/scientific-software/prism/), Adobe Illustrator CC 2018 (https://www.adobe.com/au/products/illustrator.html), Leica LAS X (https://www.leica-microsystems.com/products/microscope-software/p/leica-application-suite/), IMARIS Image Analysis Software v8 (BITPLANE, Switzerland) (https://imaris.oxinst.com/).
|
