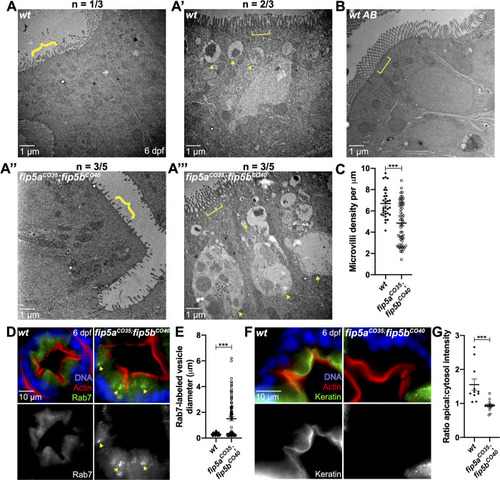
fip5a and fip5b double mutants show severe microvilli and trafficking phenotypes. All following images are representative cross sections through the midgut region of 6 dpf larvae. (A–A′′′′) Electron micrographs showing wild-type siblings and fip5aCO35/CO35; fip5bCO40/CO40 zygotic mutant larvae. Arrows point to larger than 500 nm organelles, braces point out sparse microvilli and brackets mark terminal web or lack thereof in mutants. N indicates number of representative larvae out of total number of larvae analyzed. (B) Electron micrograph showing wild-type AB larva. (C) Quantitation of microvilli density. Each dot represents the number of microvilli per micron for a field of view across three wild-type and five mutant animals. (D) Immunohistochemistry on cross sections of wild-type and fip5aCO35; fip5bCO40 mutant larvae stained with Hoechst (blue), Phalloidin (red), and Rab7 (green). (E) Quantitation of Rab7-vesicle diameter. (F) Immunohistochemistry on cross sections of wild-type and fip5aCO35; fip5bCO40 mutant larvae stained with Hoechst (blue), Phalloidin (red) and Cytokeratin (green). (G) Ratio of fluorescence intensity of apical keratin to cytoplasmic keratin. Three separate animals for each condition were analyzed. All plots show mean±s.e.m. A t-test was used for Gaussian data and a Mann–Whitney test for all other statistics. ***P<0.0005.
|
