
FIGURE 5
- ID
- ZDB-FIG-200829-90
- Publication
- Min et al., 2020 - Systems Analysis of Biliary Atresia Through Integration of High-Throughput Biological Data
- Other Figures
- All Figure Page
- Back to All Figure Page
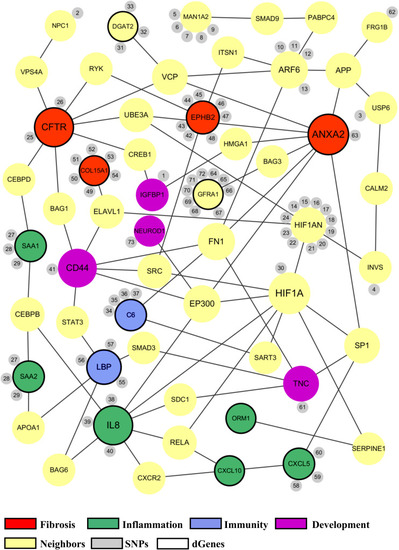
Common biological functions in the proposed biliary atresia network. All of the significant genes in the proposed BA network were annotated to identify common biological functions within the network. The red nodes represent the genes related to fibrosis, green related to inflammation, blue related to immune response, and purple related to development. The size of a node depends on the connectivity within the network; the larger the node, the more connected it is to other genes. The yellow nodes represent the neighbor genes that link different significant genes through protein-protein interaction. The small gray nodes represent the SNPs that are associated with their attached genes. The entire list of SNPs, both novel and known, can be found in the |