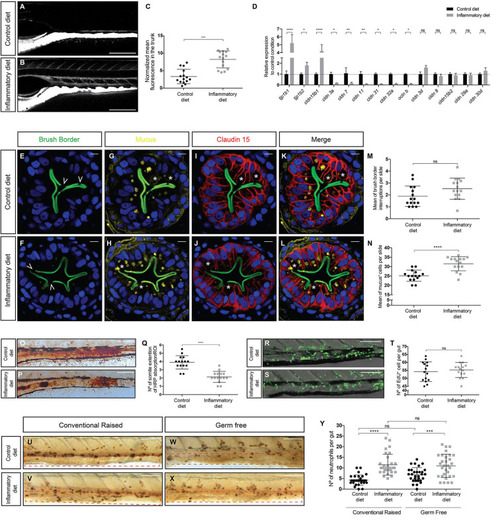
Intestinal inflammation induced by soybean meal alters intestinal physiology and is independent of the presence of microbiota. (A,B) Lateral view of the mid-intestine of 9 dpf larvae showing the diffusion of dextran in control (A) and inflamed (B) larvae. Scale bar, 200 um. (C) Normalized dextran fluorescence quantification in the trunk of control and inflamed larvae. (D) Relative mRNA expression of several tight junction proteins. All data was normalized against rpl13a and compared to the control condition (dotted line). (E–L) Transversal cryosection of the midintestine of 9 dpf control and inflamed larvae. (E–J) Immunofluorescence labeling the brush border (E,F), mucus (G,H), and Claudin 15 (I,J); nuclei were stained with DAPI (blue). (K,L) Merge of the four channels in control and inflamed larvae. Scale bar, 5 um. (M,N) Quantification of brush border interruptions (white arrowheads in E,F) and goblet cells (white asterisks in G and H). (O,P) Representative images of the area of the midintestine showing HRP absorption in control and inflamed larvae. Scale bar, 100 um. (Q) Quantification of the area covered by HRP in the midintestine of control and inflamed larvae. (R,S) Representative images showing the number of cell that proliferate during 16 h in control and inflamed larvae. Scale bar, 100 um. (T) Quantification of EdU+ cells in the midintestine per larva. (U–X) Lateral view of the midintestine showing immunohistochemistry against the neutrophil marker Mpx on those conventionally raised. The area quantified is delimited by the red dotted rectangle (U,V) and germ-free larvae (W,X). Scale bar, 100 um. (Y) Quantification of the amount of neutrophils present in the midintestine in conventionally raised and germ-free larvae. Permeability, immunofluorescence, protein absorption, proliferation assay, and immunohistochemistry were performed at least in three biological replicates with 15 larvae of 9 dpf per condition. Statistical analysis was performed using the Mann–Whitney U-test, ***p < 0.001, ****p > 0.0001. RT-qPCR was performed at least in three biological replicates with 100 intestines from 9 dpf larvae per condition. Statistical analysis was analyzed using one-way ANOVA and Tukey multiple comparison test. ns, non-significant, *p < 0.05, **p < 0.01, and ****p < 0.0001.
|
