FIGURE

Figure 5

ID
ZDB-FIG-200720-13
Publication
Amorim et al., 2020 - A Conserved Notochord Enhancer Controls Pancreas Development in Vertebrates
Other Figures
All Figure Page
Back to All Figure Page
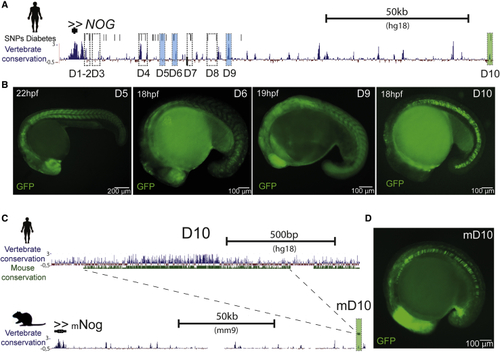
Figure 5

The Expression of Nog in the Notochord Is Conserved in Vertebrates and Is Mediated by Equivalent Notochord Enhancers

(A) Genomic landscape of human NOG, comprising approximately 150 kb. Black vertical lines represent SNPs associated with diabetes from the Diabetes Genetics Replication and Meta-analysis (DIAGRAM) Consortium (p < 0.02) (Morris et al., 2012; Pasquali et al., 2014). The dark blue track represents vertebrate conservation and shows multiple alignments of 100 vertebrate species and measurements of evolutionary conservation (phyloP) (Pollard et al., 2010). Dashed line boxes are putative enhancer sequences selected for enhancer assays. Sequences in pale blue shaded boxes showed reproducible expression patterns. D10 (green shaded box) showed enhancer activity in the notochord. Scale bar represents 50 kilobases.

(B) Representative images of GFP reporter lines for enhancers D5, D6, D9, and D10 (see also Figure S5). Scale bars represent 100 or 200 μm.

(C) Genomic landscape of the human D10 sequence, showing vertebrate (blue track) and mouse conservation (green track) (above). Genomic landscape of mouse Nog, including the conserved mouse D10 (mD10) sequence, located approximately 150 kb downstream of the promoter (see also Figures S5 and S6). Scale bars represent 500 basepairs or 50 kilobases.

(D) Representative image of the GFP reporter line for the mouse enhancer mD10. Scale bar represents 100 μm.

Expression Data

Expression Detail
Antibody Labeling
Phenotype Data

Phenotype Detail
Acknowledgments
This image is the copyrighted work of the attributed author or publisher, and ZFIN has permission only to display this image to its users. Additional permissions should be obtained from the applicable author or publisher of the image. Full text @ Cell Rep.