
Fig. 1
- ID
- ZDB-FIG-200716-93
- Publication
- Fukuda et al., 2019 - Metabolic modulation regulates cardiac wall morphogenesis in zebrafish
- Other Figures
- All Figure Page
- Back to All Figure Page
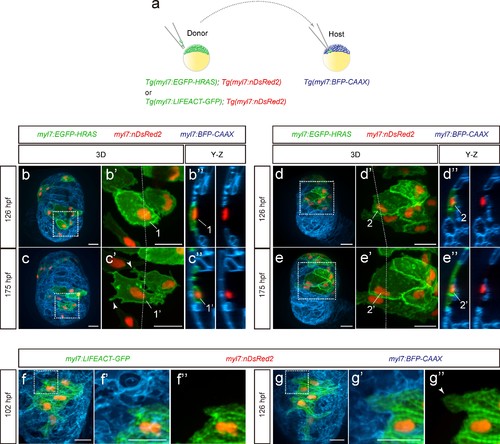
Cardiomyocyte behavior during cardiac trabeculation.(a) Schematic of the transplantation experiment. (b–e) 3D time-course images of chimeric hearts; magnified view (b’, c’, d’, e’) of area in white boxes and Y-Z plane images (b”, c”, d”, e”) along white dashed lines (b’, c’, d’, e’). CMs initially in the compact layer (b’, b”) enter the trabecular layer (c’, c”) exhibiting morphological changes and membrane protrusions (c’; arrowheads; n = 5 CMs); CMs remaining in the compact layer (d’, d”, e’, e”) do not exhibit obvious morphological changes (n = 5 CMs). The same CMs are shown at 126 and 175 hpf as indicated in the images. (f, g) 3D time-course images of chimeric heart; magnified view (f’, f”, g’, g”) of area in white boxes. CMs entering the trabecular layer exhibit partial disassembly of their sarcomeres (g’; arrowhead). Scale bars, 20 μm. |