FIGURE

Figure 4—figure supplement 1.

ID
ZDB-FIG-200715-13
Publication
Hansen et al., 2020 - Nanobody-directed targeting of optogenetic tools to study signaling in the primary cilium
Other Figures
All Figure Page
Back to All Figure Page
Figure 4—figure supplement 1.

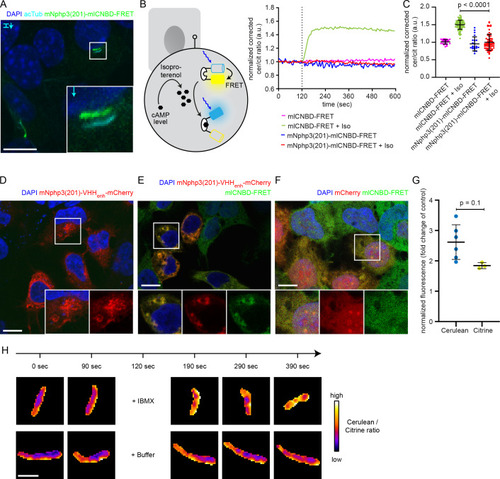
Characterization of the ciliary-targeted cAMP mlCNBD-FRET biosensor.

(A) Localization of mNphp3(201)-mlCNBD-FRET to primary cilia in mIMCD-3 cells. (B) FRET imaging in non-ciliated HEK293 cells expressing mlCNBD-FRET or mNphp3(201)-mlCNBD-FRET under control conditions or after stimulation with 20 μM isoproterenol (addition depicted with dotted line). Data are shown as mean (n = 3 independent experiments, 30–90 cells per experiment). Schematic overview of mlCNBD-FRET imaging is shown on the left. (C) Comparison of the maximal FRET change for data shown in B. Data are presented as individual data points and mean ± S.D.; p-value calculated using a two-tailed Mann-Whitney test is indicated. (D) Localization of mNphp3(201)-VHHenhancer-mCherry in HEK293 cells. The box indicates the position of the magnified view shown at the bottom for the individual channels. (E./F) Localization of mlCNBD-FRET in HEK293 cells in the presence (E) or absence (F) of mNphp3(201)-VHHenhancer-mCherry. In F, mCherry only was used as a control. Scale bar: 10 μm. The box in indicates the position of the magnified view shown at the bottom. left: overlay; middle and right: individual channels. (G) HEK293 cells were transfected with cerulean or citrine in the presence of mCherry (control) or the eGFP nanobody mNphp3(201)-VHHenhancer-mCherry. Fluorescence intensities of cerulean or citrine were normalized to the mCherry fluorescence of the nanobody or mCherry only in the same cell, and the relative change in fluorescence compared to the control condition (mCherry only) was plotted. Data are shown as mean ± S.D., n = 3–6 with 2–30 cells per experiment; p-values were determined using an unpaired, two-sided Student’s t-test. (H) FRET imaging in primary cilia of mIMCD-3 cells expressing mlCNBD-FRET and mNphp3(201)-VHHenhancer-mCherry. Cells have been stimulated with 250 μm IBMX (top) or buffer only (bottom). Images show the change in cerulean/citrine ratio (color-scheme indicated on the right) from different time points (top) of Video 1. Scale bar: 2 μm.

Expression Data

Expression Detail
Antibody Labeling
Phenotype Data

Phenotype Detail
Acknowledgments
This image is the copyrighted work of the attributed author or publisher, and ZFIN has permission only to display this image to its users. Additional permissions should be obtained from the applicable author or publisher of the image. Full text @ Elife