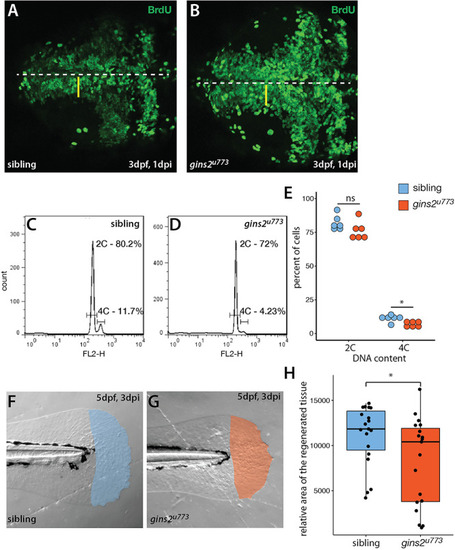
gins2u773 mutants show cell proliferation defects. (A,B) The intensity of fluorescence of BrdU labeling in the OT of a 3 dpf wildtype embryo shows a medio-lateral gradient. In contrast, mutant embryos showed a uniform distribution of the BrdU label. Dorsal views of the OT are shown, with anterior to the left. Midline is marked by the dashed line, yellow bars denote the proliferative area with a medial to lateral gradient of fluorescence in wildtype. (C,D) Representative histograms of flow cytometry analysis of wildtype and mutant samples. (E) DNA content analysis of propidium-iodide-labeled cells isolated from the head region showed no obvious change in the number of cells with 2C (p = 0.15, n = 6), and a slight, but significant decrease in the number of cells with 4C (p = 0.01, n = 6 independent samples). (F,G) Regenerated area of the caudal fin in wildtype siblings and mutant embryos following amputation at 2 dpf. (H) At 3 days post injury (dpi) the size of the regenerated fin fold was slightly but significantly smaller in mutant larvae than in controls (p = 0.038, n = 19).
|
